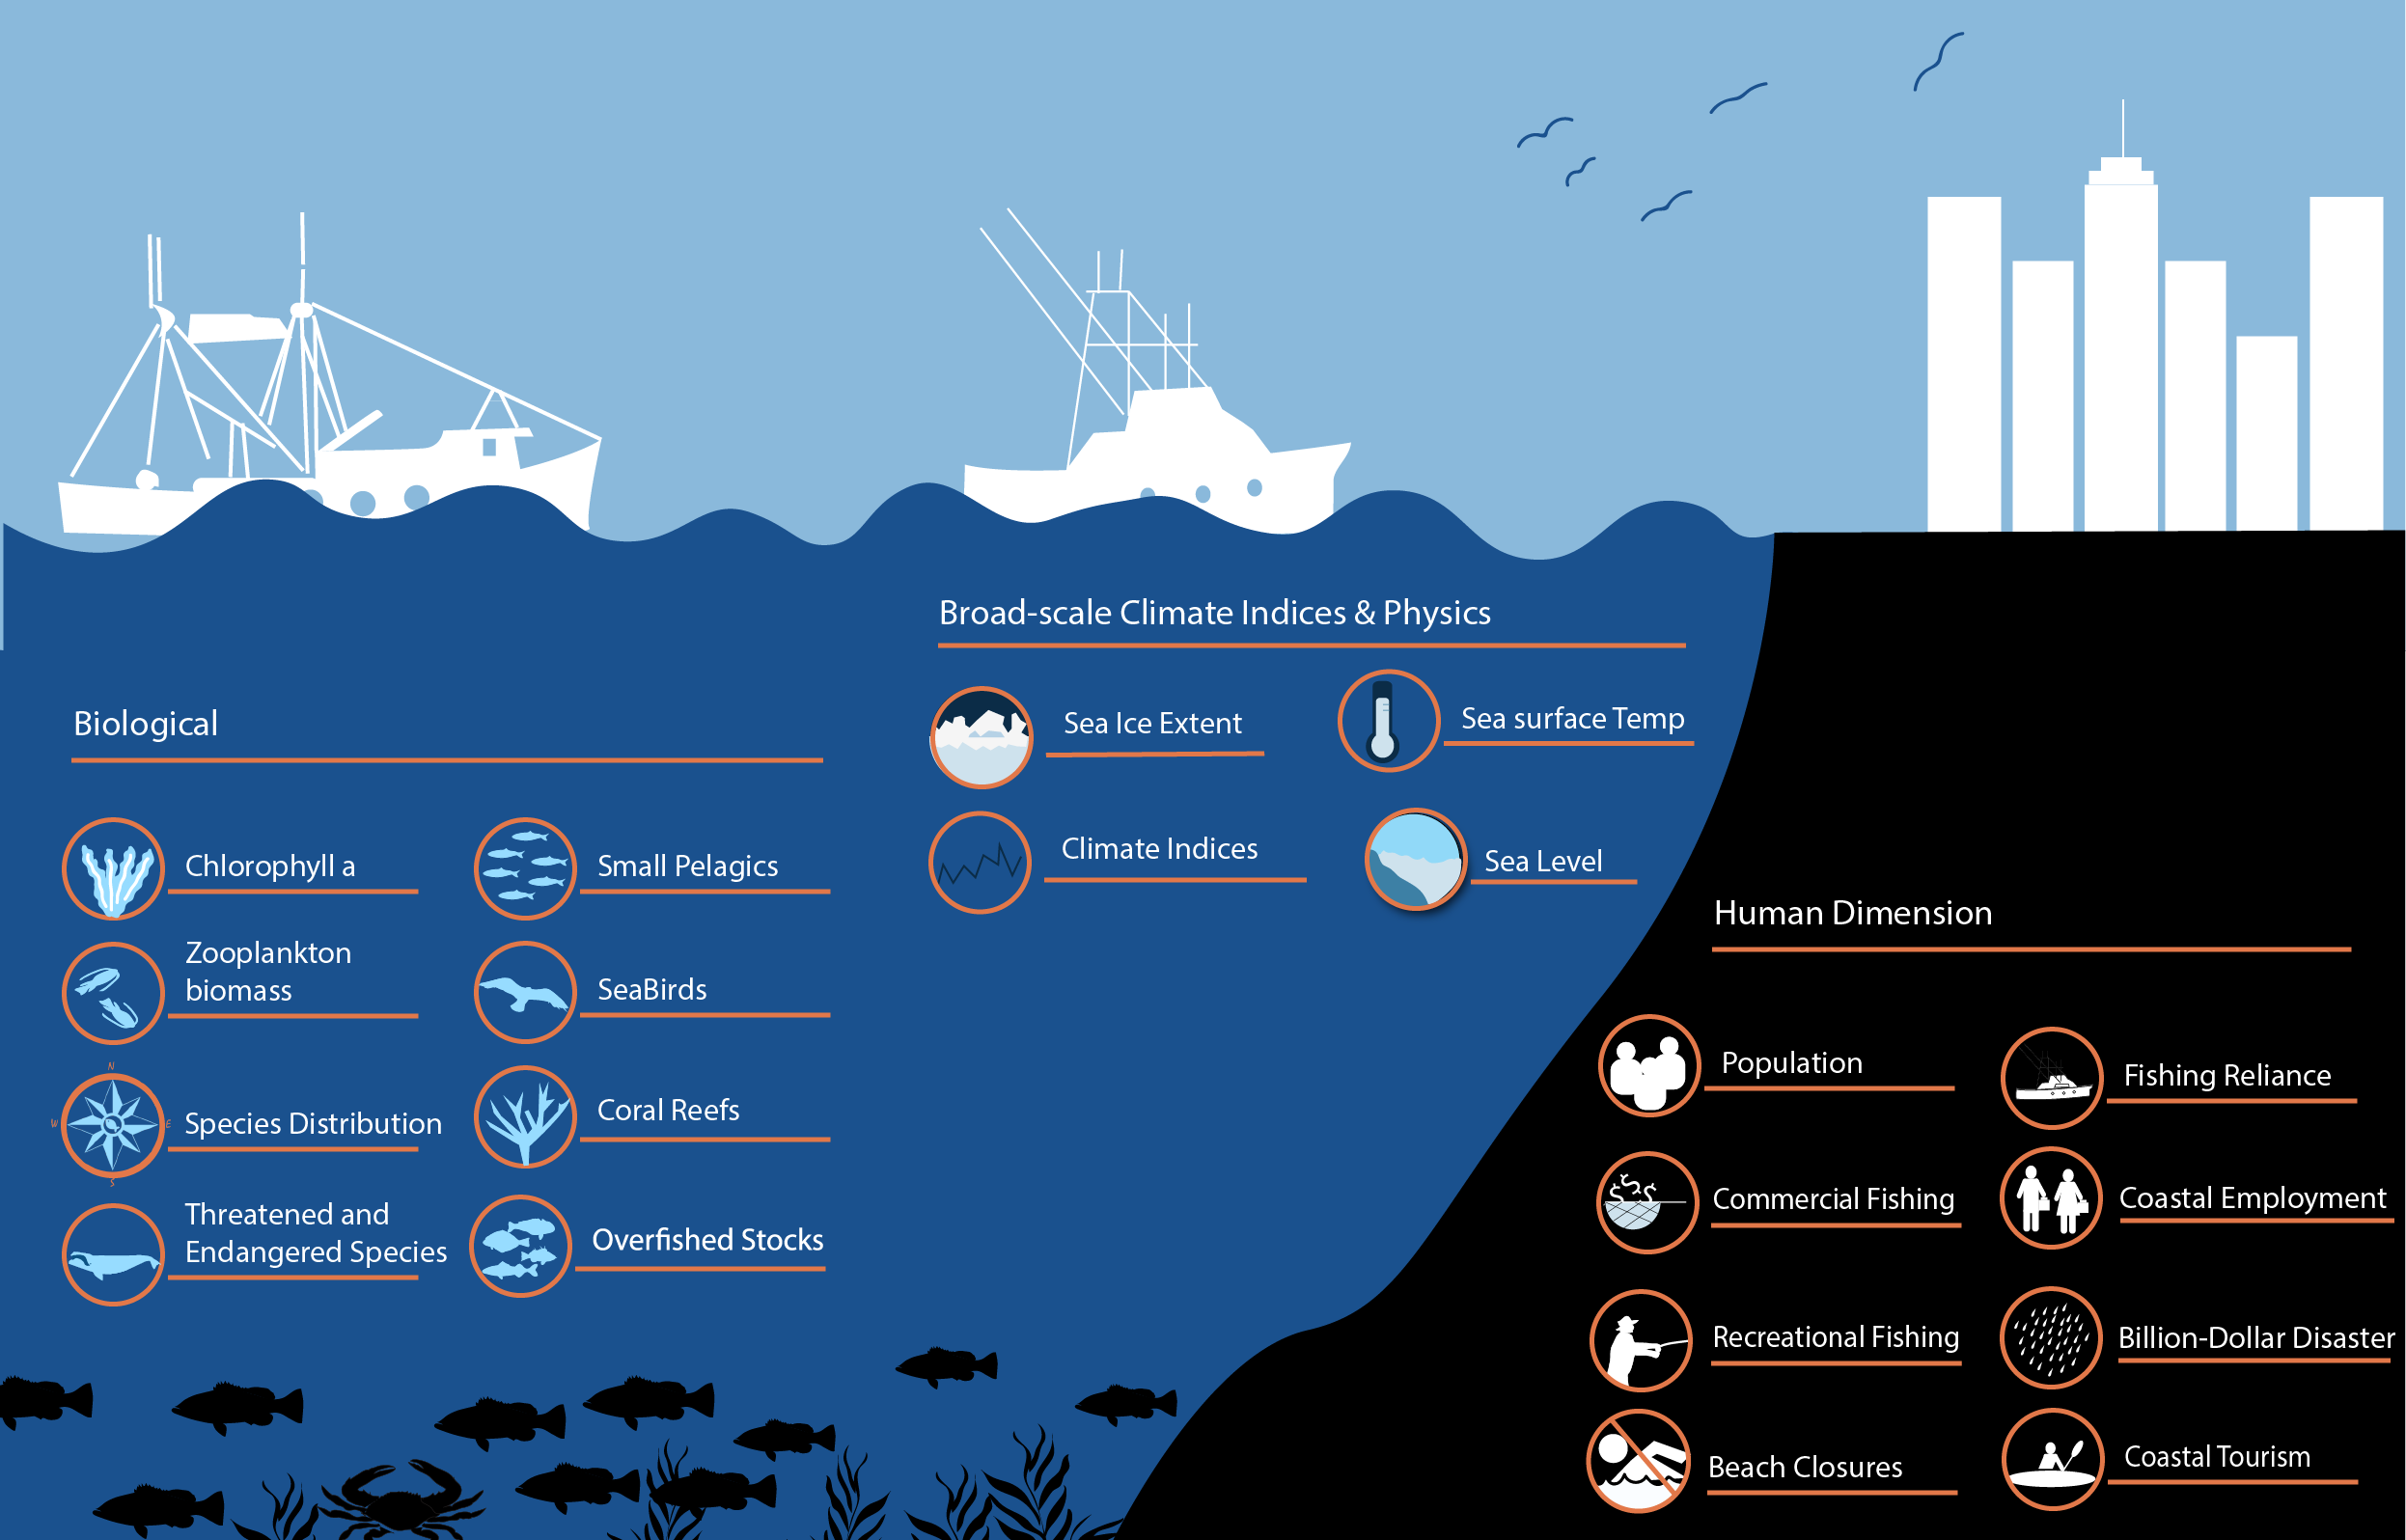
Marine ecosystem with icons for each of the key indicators that will be presented on this website
(Click to enlarge)
The National Marine Ecosystem Status Website was created to provide a snapshot of major U.S. marine ecosystem indicators. This site captures the status and trends of seven U.S. ecosystem regions and overall, national status while also providing the opportunity to explore the key indicators for a particular topic area. This site provides users with links to more detailed sources of NOAA data and information. Information on this site is sourced from publicly available data and is updated annually.
By tracking and communicating these data both spatially and thematically, we can monitor the status of U.S. ocean and coastal ecosystems that provide food, jobs, security, and well-being to millions of people. This reporting is meant to allow the U.S. population to see the performance of their marine ecosystems.
The National Marine Ecosystem Status web portal provides the status of marine ecosystems across the U.S. and access to NOAA ecosystem indicator information and data. Check out this presentation or click on "How to Use this Website" above to walk through how you can access information on this site.
Definition of indicators: Ecosystem indicators are quantitative and/or qualitative measures of key components of the ecosystem. Marine ecosystems provide food, jobs, security, well-being, and other services to millions of people across the U.S. Yet, marine ecosystems and the people that rely on them are facing increasingly complex challenges. Tracking the status and trends of ocean and coastal ecosystems is critically important to understand how these ecosystems are changing and identify potential issues.
Ecological
Understanding the status of key components of the ecosystem including human activities and well-being is essential because of the interlinkages between components. For example, broad-scale climate patterns such as the Pacific Decadal Oscillation (PDO) impact the temperature of the ocean. These broad-scale climate patterns interact with shorter scale climate to impact plankton by changing what species are present, how they grow, and where they are. Phytoplankton are often measured by chlorophyll-a and serve the base of the food web. Primary consumers such as zooplankton and small pelagic fish eat phytoplankton. Larger fish eat zooplankton and other small fish. Marine mammals then feed on plankton, smaller, and larger fish. Humans consume seafood from across the ecosystem. Humans also rely on various ocean services such as tourism, seafood, and recreational activities for employment, recreation, and income.
Human Dimensions
Marine environments are important for people all across the country, but particularly so for people living in coastal communities. In the United States, coastal counties account for 39 percent of the total population (NOS). There are hundreds of thousands of ocean-dependent business establishments in these communities, employing millions of people and paying over $100 billion in wages annually. Employment in the ocean economy, including recreation, tourism, travel, and seafood industries, continues to grow faster than the U.S. economy as a whole.
Challenges to the Ecosystem
This ocean economy and human welfare more broadly are impacted by overfished stocks, hurricanes and other natural disasters which can cost billions of dollars, loss of threatened and endangered species, and beach closures. Overfishing is when the annual rate of catch of fish and other animals is too high and impacts businesses, the availability of seafood, and more. The number of weather and climate-related disasters exceeding 1 billion dollars, termed a billion-dollar disaster, has increased in the United States since 1980. Under the Endangered Species Act (ESA), a species is considered endangered if it is in danger of extinction throughout all or a significant portion of its range or threatened if it is likely to become endangered in the foreseeable future. These iconic species are important not only for coastal tourism such as whale watching but also critical for ecosystem functioning. Beach closures occur when beach water quality is determined to be unsafe for humans, which can have significant impacts on human health, the economy, and the ecosystem.
These key components, from sea surface temperature to coastal tourism, are all interconnected and play important roles in the overall functioning of these ecosystems. This philosophy, which considers human and physical-chemical indicators that affect biological components of an ecosystem, all as an integrated whole, is known as an “ecosystem-based” approach. More information about this can be found on the “Ecosystem-Based Management” tab. By tracking the status and trends of these components over time, this information can help us to better understand the current state of all parts of U.S. marine ecosystems.
This website is designed to help users track and monitor the overall status of U.S. marine ecosystems while consolidating links to data and resources from NOAA (and our partners) for those interested in a deeper dive. Biological, physio-chemical, climate, and human dimensions indicators are included for each region in the ecosystem status portal because the factors from each of these categories are interconnected, potentially affecting one another as well as the overall status of the ecosystems.
This approach is known as an “ecosystem-based” approach—this philosophy differs from single-variable or single-species approaches to monitoring and management by considering a suite of variables to inform important decisions about resource management or ecosystem conditions rather than one or two isolated indicators. The data hosted on this site are a good example of the types of information that could be used to support Ecosystem-Based Management.
Ecosystem-Based Management (EBM)
“Ecosystem-Based Management (EBM) is an integrated management approach that recognizes the full array of interactions within an ecosystem, including humans, rather than considering single issues, species, or ecosystem services in isolation.”
-NOAA
EBM is a broad resource management approach that considers dynamic, cumulative effects on marine environments using data and indicators like those hosted on this website. EBM supports working across sectors to consider tradeoffs between marine resources, ultimately sustaining both diverse ecosystems as well as the services they provide to humans. According to NOAA, the core components of EBM are:
- Being adaptive, flexible, and responsive to monitoring and research results
- Being place-based with geographic areas defined by ecological criteria
- Being cross-sectoral, considering interactions between sectors of human activity
- Being proactive, incorporating tradeoffs to manage the marine and coastal environments
- Being inclusive and collaborative, encourages participation from all levels of government, indigenous peoples, stakeholders
For more information, use the resources linked below:
Ecosystem indicators are measures of the natural, social, and economic condition of the system. For example, scientists track the amount of revenue brought in by commercial fishing to measure how commercial fishing businesses are doing. Such indicators provide the ability to tell whether ecosystem attributes of interest are changing relative to management goals and objectives, and in some cases may provide the ability to predict how the system will change and assess related risk.
Criteria for choosing a new indicator or retiring an existing indicator on this site relate both to the data sourced to develop and measure the indicator, and the indicator properties.
Indicators should meet the following Indicator Criteria:
- Indicators should be theoretically sound, reliably represent key ecosystem attributes and hold up to peer review.
- Indicators should have demonstrable importance to the ecosystem (e.g., keystone or structural architect species) and society (e.g charismatic or subsistence species))
- Indicators should be relevant and understandable to management, to the public, and to policy makers
- Indicators should be responsive, showing sensitivity to and reacting predictably to environmental variability and/or management or policy actions.
- The direction of response should be theoretically- or empirically-expected.
- When possible, indicators should provide early warning of ecosystem change.
- Indicators should complement the indicators already served on the portal in ways such that they are not redundant
Data used to develop indicators should meet the following Data Criteria:
- Data should be publicly available and be quantitative whenever possible. Qualitative information and expert opinion can provide context for quantitative indicators.
- Data should be specific, preferably directly measurable or observable.
- Data should be updated on a regular basis, preferably at least annually.
- Time-series should be long-term (>10-years preferred) and likely to extend for the foreseeable future.
- Data collection that is cost effective for the program collecting the data is preferable to increase the likelihood the data set will continue to be collected and maintained over time.
- For nascent time series that have less than 10 years measurement, careful consideration of statistical treatment is required. In some cases reporting just the raw data is appropriate.
- For long-term climatological indices, recent short-term (e.g., last five years) trend analysis may not be appropriate.
- Some important data, such as those relating to corals, pH, oxygen etc. may be considered for use even if not regularly monitored.
- Careful consideration and explanation of the limits of such data must be documented and communicated on the NaMES web portal.
- Data should have appropriate and adequate spatial coverage.
- Ideally there will be data from each US Large Marine Ecosystem (LME), providing national coverage and the ability to synthesize the data across all regions.
- Some data (e.g., sea ice) are not readily available for all regions and in these cases full spatial coverage in all relevant areas is important.
- Some data (e.g., seabirds) do not cover the full region in relevant areas nor all species.
- Careful consideration and explanation of the limits of such data must be documented and communicated on the NaMES web portal.
- Normal ranges of spatial (e.g. patchiness) and temporal (e.g. diel, seasonal, annual, and decadal) variation for data should be considered to ascertain status and trends.
- Data should have sufficient signal-to-noise ratio to estimate measurement, process uncertainty, and detect significant change.
If you would like to propose a new indicator, please use this google form.
The following are members of NOAA Research Council’s Ecosystem Indicators Working Group who developed this website and the status reports. Should you have any questions, want to report an error or correction, or request that we consider adding links to additional marine ecosystem data, please let us know at NMFS.EIWG@noaa.gov
Jason Link -- NMFS
Stephanie Oakes - NMFS
Chris Kelble - OAR
Steve Gittings - NOS
Scott Cross - NESDIS
Geret DePiper - NMFS
Ellen Spooner - NMFS
Hassan Moustahfid - NOS
Erica Towle - CRCP
Sarah Hile - NOS
Kate Quigley - NOS
Zac Cannizzo - OAR
Will Klajbor - Knauss Fellow
Laura Ingulsrud - NMFS
Veronica Lance - NESDIS