
Description of Coastal Tourism:
U.S. coasts are host to a multitude of travel, tourism, and recreation activities. To manage our coasts, plan for development, and assess impacts as a result of coastal hazards including sea level rise, it is important to have baseline economic information. To accomplish this, we need indicators of the economic value of recreation and tourism. We present the annual total change in billions of dollars of goods and services (GDP), employment and annual wages provided from tourism industries in the Gulf of Mexico, Mid-Atlantic, Northeast, Hawaii-Pacific Islands, Southeast, and California Current regions. This data does not include industries located in U.S. territories.
Data Source:
Coastal Tourism GDP, employment, and real wage data was taken from NOAA’s Office of Coastal Management Economics: National Ocean Watch (ENOW) custom report building tool, with contextual data taken from the 2020 NOAA Report on the U.S. Marine Economy: Regional and State Profiles. Growth was estimated by subtracting the previous year’s value from the current year’s value, then dividing by the previous year’s value to present a percentage. All data was deflated to 2012 constant dollars using the Bureau of Economic Analysis’ chained dollar methodology.
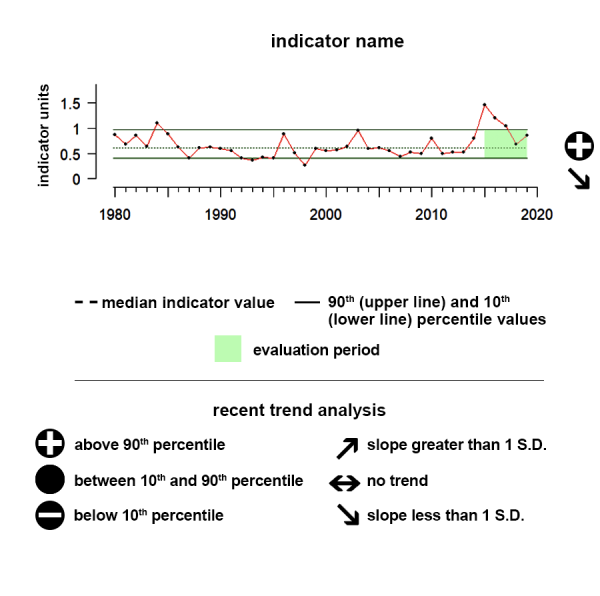
Understanding the Time series plots
Time series plots show the changes in each indicator as a function of time, over the period 1980-present. Each plot also shows horizontal lines that indicate the median (middle) value of that indicator, as well as the 10th and 90th percentiles, each calculated for the entire period of measurement. Time series plots were only developed for datasets with at least 10 years of data. Two symbols located to the right of each plot describe how recent values of an indicator compare against the overall series. A black circle indicates whether the indicator values over the last five years are on average above the series 90th percentile (plus sign), below the 10th percentile (minus sign), or between those two values (solid circle). Beneath that an arrow reflects the trend of the indicator over the last five years; an increase or decrease greater than one standard deviation is reflected in upward or downward arrows respectively, while a change of less than one standard deviation is recorded by a left-right arrow.
Percent Change in Coastal Tourism Sector GDP
Alaska
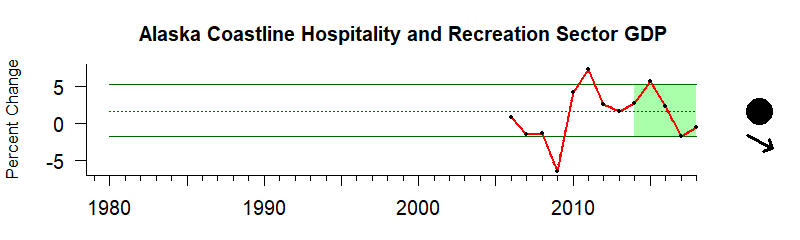
Values correspond to percent change in the GDP of the Tourism Sector of Coastal Counties in US States that border a region
Description of Time Series: Between 2014 and 2018 the average change in coastal county tourism GDP showed a decreasing trend.
Description of Gauge: The gauge value of 54 indicates that between 2014 and 2018 the average change in coastal county tourism sector GDP was higher than the median change in coastal county tourism sector GDP between 2006 and 2018.
Extreme Gauge values:
A value of zero on the gauge means that the average coastal tourism GDP over the last 5 years of data was below any annual coastal tourism GDP level up until that point, while a value of 100 would indicate the average over that same period was above any annual coastal tourism GDP value up until that point.
Indicator Source Information
Coastal tourism Gross Domestic Product is the total measure (in billions of 2012 dollars) of goods and services provided from various industries involved in tourism services and products along the coast. Data for Coastal Counties come from the US Census Bureau. This dataset represents US counties and independent cities which have at least one coastal border and select non-coastal counties and independent cities based on proximity to estuaries and other coastal counties. The dataset is built to support coastal and ocean planning and other activities pursuant to the Energy Policy Act, Coastal Zone Management Act, Magnuson-Stevens Fishery Conservation and Management Act, National Environmental Policy Act, Rivers and Harbors Act and the Submerged Lands Act.
Hawai'i
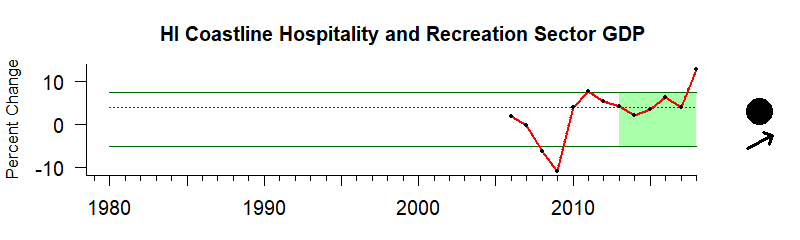
Values correspond to percent change in the GDP of the Tourism Sector of Coastal Counties in US States that border a region
Description of Time Series: Between 2014 and 2018 the average change in coastal county tourism GDP showed an increasing trend.
Description of Gauge: The gauge value of 77 indicates that between 2014 and 2018 the average change in coastal county tourism sector GDP was much higher than the median change in coastal county tourism sector GDP between 2006 and 2018.
Extreme Gauge values:
A value of zero on the gauge means that the average coastal tourism GDP over the last 5 years of data was below any annual coastal tourism GDP level up until that point, while a value of 100 would indicate the average over that same period was above any annual coastal tourism GDP value up until that point.
Indicator Source Information
Coastal tourism Gross Domestic Product is the total measure (in billions of 2012 dollars) of goods and services provided from various industries involved in tourism services and products along the coast. Data for Coastal Counties come from the US Census Bureau. This dataset represents US counties and independent cities which have at least one coastal border and select non-coastal counties and independent cities based on proximity to estuaries and other coastal counties. The dataset is built to support coastal and ocean planning and other activities pursuant to the Energy Policy Act, Coastal Zone Management Act, Magnuson-Stevens Fishery Conservation and Management Act, National Environmental Policy Act, Rivers and Harbors Act and the Submerged Lands Act.
California Current
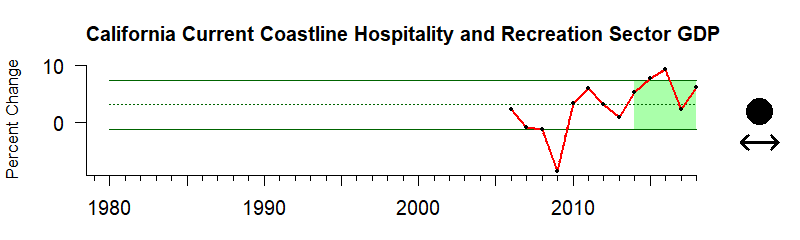
Values correspond to percent change in the GDP of the Tourism Sector of Coastal Counties in US States that border a region
Description of Time Series: Between 2014 and 2018 the average change in coastal county tourism GDP showed no significant trend.
Description of Gauge: The gauge value of 77 indicates that between 2014 and 2018 the average change in coastal county tourism sector GDP was much higher than the median change in coastal county tourism sector GDP between 2006 and 2018.
Extreme Gauge values:
A value of zero on the gauge means that the average coastal tourism GDP over the last 5 years of data was below any annual coastal tourism GDP level up until that point, while a value of 100 would indicate the average over that same period was above any annual coastal tourism GDP value up until that point.
Indicator Source Information
Coastal tourism Gross Domestic Product is the total measure (in billions of 2012 dollars) of goods and services provided from various industries involved in tourism services and products along the coast. Data for Coastal Counties come from the US Census Bureau. This dataset represents US counties and independent cities which have at least one coastal border and select non-coastal counties and independent cities based on proximity to estuaries and other coastal counties. The dataset is built to support coastal and ocean planning and other activities pursuant to the Energy Policy Act, Coastal Zone Management Act, Magnuson-Stevens Fishery Conservation and Management Act, National Environmental Policy Act, Rivers and Harbors Act and the Submerged Lands Act.
Gulf of Mexico
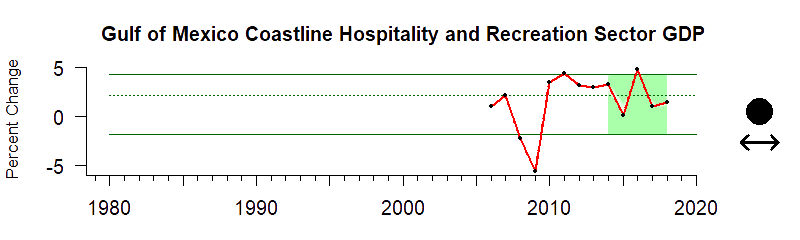
Values correspond to percent change in the GDP of the Tourism Sector of Coastal Counties in US States that border a region
Description of Time Series: Between 2014 and 2018 the average change in coastal county tourism GDP showed no significant trend.
Description of Gauge: The gauge value of 54 indicates that between 2014 and 2018 the average change in coastal county tourism sector GDP was higher than the median change in coastal county tourism sector GDP between 2006 and 2018
Extreme Gauge values:
A value of zero on the gauge means that the average coastal tourism GDP over the last 5 years of data was below any annual coastal tourism GDP level up until that point, while a value of 100 would indicate the average over that same period was above any annual coastal tourism GDP value up until that point.
Indicator Source Information
Coastal tourism Gross Domestic Product is the total measure (in billions of 2012 dollars) of goods and services provided from various industries involved in tourism services and products along the coast. Data for Coastal Counties come from the US Census Bureau. This dataset represents US counties and independent cities which have at least one coastal border and select non-coastal counties and independent cities based on proximity to estuaries and other coastal counties. The dataset is built to support coastal and ocean planning and other activities pursuant to the Energy Policy Act, Coastal Zone Management Act, Magnuson-Stevens Fishery Conservation and Management Act, National Environmental Policy Act, Rivers and Harbors Act and the Submerged Lands Act.
Southeast
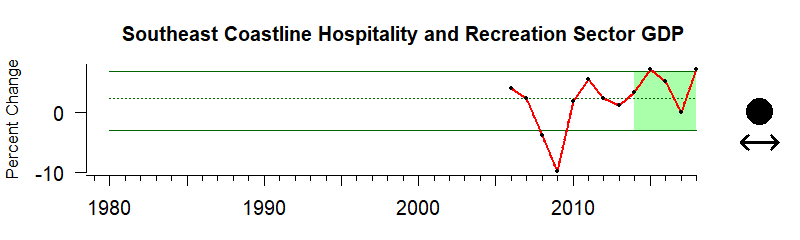
Values correspond to percent change in the GDP of the Tourism Sector of Coastal Counties in US States that border a region
Description of Time Series: Between 2014 and 2018 the average change in coastal county tourism GDP showed no significant trend.
Description of Gauge: The gauge value of 69 indicates that between 2014 and 2018 the average change in coastal county tourism sector GDP was higher than the median change in coastal county tourism sector GDP between 2006 and 2018.
Extreme Gauge values:
A value of zero on the gauge means that the average coastal tourism GDP over the last 5 years of data was below any annual coastal tourism GDP level up until that point, while a value of 100 would indicate the average over that same period was above any annual coastal tourism GDP value up until that point.
Indicator Source Information
Coastal tourism Gross Domestic Product is the total measure (in billions of 2012 dollars) of goods and services provided from various industries involved in tourism services and products along the coast. Data for Coastal Counties come from the US Census Bureau. This dataset represents US counties and independent cities which have at least one coastal border and select non-coastal counties and independent cities based on proximity to estuaries and other coastal counties. The dataset is built to support coastal and ocean planning and other activities pursuant to the Energy Policy Act, Coastal Zone Management Act, Magnuson-Stevens Fishery Conservation and Management Act, National Environmental Policy Act, Rivers and Harbors Act and the Submerged Lands Act.
Northeast
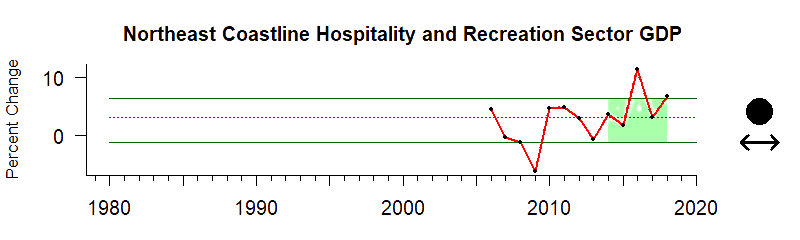
Values correspond to percent change in the GDP of the Tourism Sector of Coastal Counties in US States that border a region
Description of Time Series: Between 2014 and 2018 the average change in coastal county tourism GDP showed no significant trend.
Description of Gauge: The gauge value of 85 indicates that between 2014 and 2018 the average change in coastal county tourism sector GDP was much higher than the median change in coastal county tourism sector GDP between 2006 and 2018.
Extreme Gauge values:
A value of zero on the gauge means that the average coastal tourism GDP over the last 5 years of data was below any annual coastal tourism GDP level up until that point, while a value of 100 would indicate the average over that same period was above any annual coastal tourism GDP value up until that point.
Indicator Source Information
Coastal tourism Gross Domestic Product is the total measure (in billions of 2012 dollars) of goods and services provided from various industries involved in tourism services and products along the coast. Data for Coastal Counties come from the US Census Bureau. This dataset represents US counties and independent cities which have at least one coastal border and select non-coastal counties and independent cities based on proximity to estuaries and other coastal counties. The dataset is built to support coastal and ocean planning and other activities pursuant to the Energy Policy Act, Coastal Zone Management Act, Magnuson-Stevens Fishery Conservation and Management Act, National Environmental Policy Act, Rivers and Harbors Act and the Submerged Lands Act.
Percent Change in total Employment of the Tourism Sector in Coastal Counties
Alaska
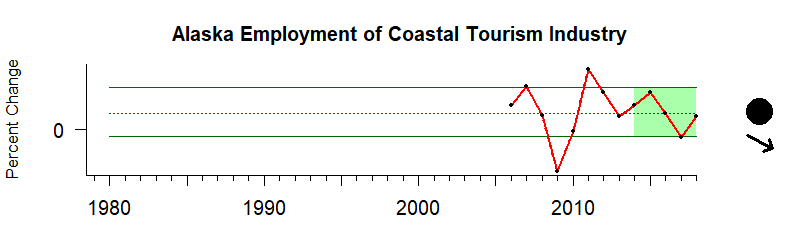
Values correspond to percent change in the total Employment of the Tourism Sector of Coastal Counties in US States that border a region
Description of Time Series: Between 2014 and 2018 the average change in coastal county employment showed a decreasing trend.
Description of Gauge: Between 2014 and 2018 the average change in coastal county tourism sector employment was higher than the median change in coastal county tourism sector employment between 2006 and 2018.
Extreme Gauge values:
A value of zero on the gauge means that the average coastal tourism employment over the last 5 years of data was below any annual coastal tourism employment level up until that point, while a value of 100 would indicate the average over that same period was above any annual coastal tourism employment level up until that point.
Indicator Source Information:
Coastal tourism employment is the total measure of jobs in tourism industries along the coast. Data for Coastal Counties come from the US Census Bureau. This dataset represents US counties and independent cities which have at least one coastal border and select non-coastal counties and independent cities based on proximity to estuaries and other coastal counties. The dataset is built to support coastal and ocean planning and other activities pursuant to the Energy Policy Act, Coastal Zone Management Act, Magnuson-Stevens Fishery Conservation and Management Act, National Environmental Policy Act, Rivers and Harbors Act and the Submerged Lands Act.
California Current
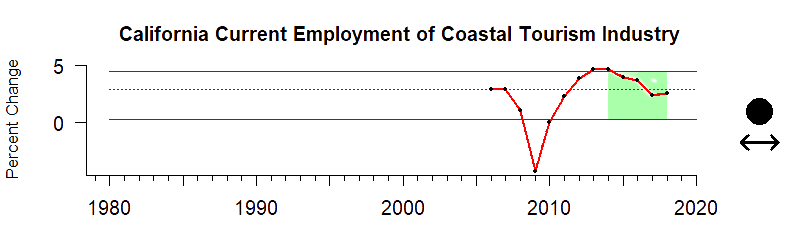
Values correspond to percent change in the total Employment of the Tourism Sector of Coastal Counties in US States that border a region
Description of Time Series: Between 2014 and 2018 the average change in coastal county employment showed no significant trend.
Description of Gauge: Between 2014 and 2018 the average change in coastal county tourism sector employment was higher than the median change in coastal county tourism sector employment between 2006 and 2018.
Extreme Gauge values:
A value of zero on the gauge means that the average coastal tourism employment over the last 5 years of data was below any annual coastal tourism employment level up until that point, while a value of 100 would indicate the average over that same period was above any annual coastal tourism employment level up until that point.
Indicator Source Information:
Coastal tourism employment is the total measure of jobs in tourism industries along the coast. Data for Coastal Counties come from the US Census Bureau. This dataset represents US counties and independent cities which have at least one coastal border and select non-coastal counties and independent cities based on proximity to estuaries and other coastal counties. The dataset is built to support coastal and ocean planning and other activities pursuant to the Energy Policy Act, Coastal Zone Management Act, Magnuson-Stevens Fishery Conservation and Management Act, National Environmental Policy Act, Rivers and Harbors Act and the Submerged Lands Act.
Gulf of Mexico
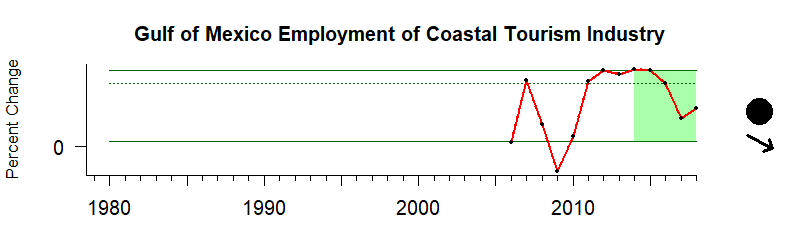
Values correspond to percent change in the total Employment of the Tourism Sector of Coastal Counties in US States that border a region
Description of Time Series: Between 2014 and 2018 the average change in coastal county employment showed a decreasing trend.
Description of Gauge: Between 2014 and 2018 the average change in coastal county tourism sector employment was lower than the median change in coastal county tourism sector employment between 2006 and 2018.
Extreme Gauge values:
A value of zero on the gauge means that the average coastal tourism employment over the last 5 years of data was below any annual coastal tourism employment level up until that point, while a value of 100 would indicate the average over that same period was above any annual coastal tourism employment level up until that point.
Indicator Source Information:
Coastal tourism employment is the total measure of jobs in tourism industries along the coast. Data for Coastal Counties come from the US Census Bureau. This dataset represents US counties and independent cities which have at least one coastal border and select non-coastal counties and independent cities based on proximity to estuaries and other coastal counties. The dataset is built to support coastal and ocean planning and other activities pursuant to the Energy Policy Act, Coastal Zone Management Act, Magnuson-Stevens Fishery Conservation and Management Act, National Environmental Policy Act, Rivers and Harbors Act and the Submerged Lands Act.
Hawai'i
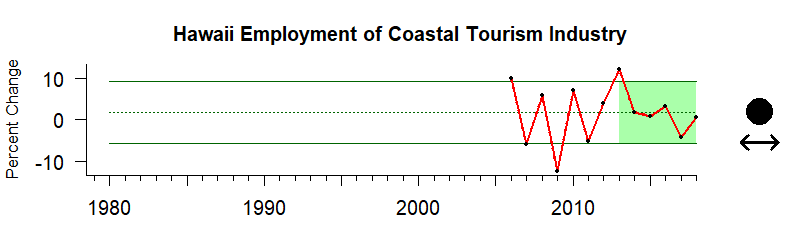
Values correspond to percent change in the total Employment of the Tourism Sector of Coastal Counties in US States that border a region
Description of Time Series: Between 2014 and 2018 the average change in coastal county employment showed no significant trend.
Description of Gauge: Between 2014 and 2018 the average change in coastal county tourism sector employment was lower than the median change in coastal county tourism sector employment between 2006 and 2018.
Extreme Gauge values:
A value of zero on the gauge means that the average coastal tourism employment over the last 5 years of data was below any annual coastal tourism employment level up until that point, while a value of 100 would indicate the average over that same period was above any annual coastal tourism employment level up until that point.
Indicator Source Information:
Coastal tourism employment is the total measure of jobs in tourism industries along the coast. Data for Coastal Counties come from the US Census Bureau. This dataset represents US counties and independent cities which have at least one coastal border and select non-coastal counties and independent cities based on proximity to estuaries and other coastal counties. The dataset is built to support coastal and ocean planning and other activities pursuant to the Energy Policy Act, Coastal Zone Management Act, Magnuson-Stevens Fishery Conservation and Management Act, National Environmental Policy Act, Rivers and Harbors Act and the Submerged Lands Act.
Northeast US
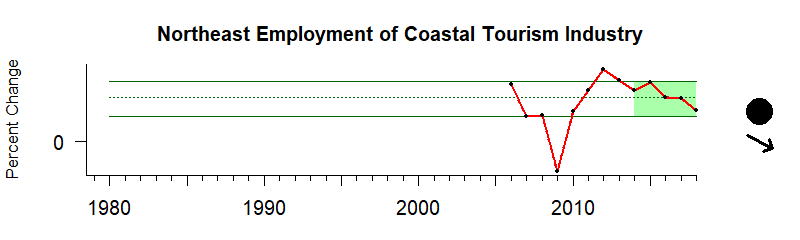
Values correspond to percent change in the total Employment of the Tourism Sector of Coastal Counties in US States that border a region
Description of Time Series: Between 2014 and 2018 the average change in coastal county employment showed no significant trend.
Description of Gauge: Between 2014 and 2018 the average change in coastal county tourism sector employment was higher than the median change in coastal county tourism sector employment between 2006 and 2018.
Extreme Gauge values:
A value of zero on the gauge means that the average coastal tourism employment over the last 5 years of data was below any annual coastal tourism employment level up until that point, while a value of 100 would indicate the average over that same period was above any annual coastal tourism employment level up until that point.
Indicator Source Information:
Coastal tourism employment is the total measure of jobs in tourism industries along the coast. Data for Coastal Counties come from the US Census Bureau. This dataset represents US counties and independent cities which have at least one coastal border and select non-coastal counties and independent cities based on proximity to estuaries and other coastal counties. The dataset is built to support coastal and ocean planning and other activities pursuant to the Energy Policy Act, Coastal Zone Management Act, Magnuson-Stevens Fishery Conservation and Management Act, National Environmental Policy Act, Rivers and Harbors Act and the Submerged Lands Act.
Southeast US
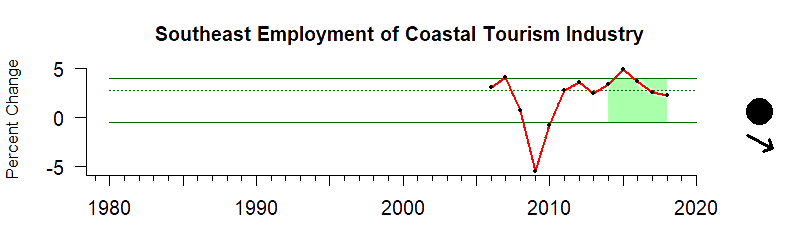
Values correspond to percent change in the total Employment of the Tourism Sector of Coastal Counties in US States that border a region
Description of Time Series: Between 2014 and 2018 the average change in coastal county employment showed no significant trend.
Description of Gauge: Between 2014 and 2018 the average change in coastal county tourism sector employment was higher than the median change in coastal county tourism sector employment between 2006 and 2018.
Extreme Gauge values:
A value of zero on the gauge means that the average coastal tourism employment over the last 5 years of data was below any annual coastal tourism employment level up until that point, while a value of 100 would indicate the average over that same period was above any annual coastal tourism employment level up until that point.
Indicator Source Information:
Coastal tourism employment is the total measure of jobs in tourism industries along the coast. Data for Coastal Counties come from the US Census Bureau. This dataset represents US counties and independent cities which have at least one coastal border and select non-coastal counties and independent cities based on proximity to estuaries and other coastal counties. The dataset is built to support coastal and ocean planning and other activities pursuant to the Energy Policy Act, Coastal Zone Management Act, Magnuson-Stevens Fishery Conservation and Management Act, National Environmental Policy Act, Rivers and Harbors Act and the Submerged Lands Act.
Percent Change in Real Wage Compensation for the Tourism Sector of Coastal Counties
Alaska
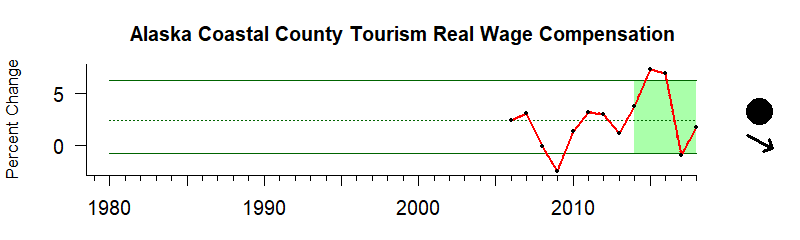
Values correspond to percent change in the total real wage compensation of the Tourism Sector of Coastal Counties in US States that border a region
Description of Time Series: Between 2014 and 2018 the average change in coastal county real wage compensation showed a decreasing trend.
Description of Gauge: Between 2014 and 2018 the average change in coastal county tourism sector real wage compensation was much higher than the median change in coastal county tourism sector real wage compensation between 2006 and 2018.
Extreme Gauge values:
A value of zero on the gauge means that the average coastal tourism wage compensation over the last 5 years of data was below any annual coastal tourism wage compensation level up until that point, while a value of 100 would indicate the average over that same period was above any annual coastal tourism wage compensation level up until that point.
Indicator Source Information:
Coastal tourism wage is the measure of wages (nominal) paid to employees in tourism industries along the coast. Data for Coastal Counties come from the US Census Bureau. This dataset represents US counties and independent cities which have at least one coastal border and select non-coastal counties and independent cities based on proximity to estuaries and other coastal counties. The dataset is built to support coastal and ocean planning and other activities pursuant to the Energy Policy Act, Coastal Zone Management Act, Magnuson-Stevens Fishery Conservation and Management Act, National Environmental Policy Act, Rivers and Harbors Act and the Submerged Lands Act.
California Current
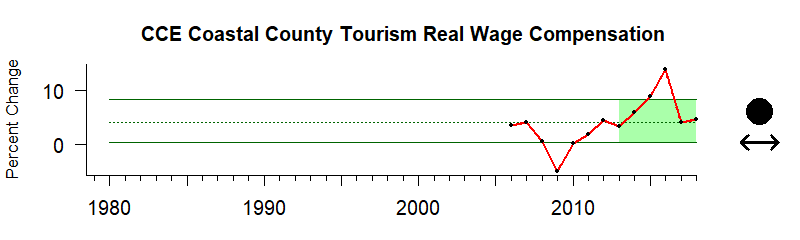
Values correspond to percent change in the total real wage compensation of the Tourism Sector of Coastal Counties in US States that border a region
Description of Time Series: Between 2014 and 2018 the average change in coastal county real wage compensation showed no significant trend.
Description of Gauge: Between 2014 and 2018 the average change in coastal county tourism sector real wage compensation was much higher than the median change in coastal county tourism sector real wage compensation between 2006 and 2018.
Extreme Gauge values:
A value of zero on the gauge means that the average coastal tourism wage compensation over the last 5 years of data was below any annual coastal tourism wage compensation level up until that point, while a value of 100 would indicate the average over that same period was above any annual coastal tourism wage compensation level up until that point.
Indicator Source Information:
Coastal tourism wage is the measure of wages (nominal) paid to employees in tourism industries along the coast. Data for Coastal Counties come from the US Census Bureau. This dataset represents US counties and independent cities which have at least one coastal border and select non-coastal counties and independent cities based on proximity to estuaries and other coastal counties. The dataset is built to support coastal and ocean planning and other activities pursuant to the Energy Policy Act, Coastal Zone Management Act, Magnuson-Stevens Fishery Conservation and Management Act, National Environmental Policy Act, Rivers and Harbors Act and the Submerged Lands Act.
Gulf of Mexico
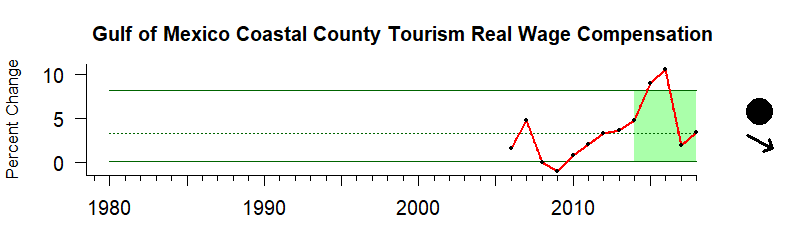
Values correspond to percent change in the total real wage compensation of the Tourism Sector of Coastal Counties in US States that border a region
Description of Time Series: Between 2014 and 2018 the average change in coastal county real wage compensation showed a decreasing trend.
Description of Gauge: Between 2014 and 2018 the average change in coastal county tourism sector real wage compensation was much higher than the median change in coastal county tourism sector real wage compensation between 2006 and 2018.
Extreme Gauge values:
A value of zero on the gauge means that the average coastal tourism wage compensation over the last 5 years of data was below any annual coastal tourism wage compensation level up until that point, while a value of 100 would indicate the average over that same period was above any annual coastal tourism wage compensation level up until that point.
Indicator Source Information:
Coastal tourism wage is the measure of wages (nominal) paid to employees in tourism industries along the coast. Data for Coastal Counties come from the US Census Bureau. This dataset represents US counties and independent cities which have at least one coastal border and select non-coastal counties and independent cities based on proximity to estuaries and other coastal counties. The dataset is built to support coastal and ocean planning and other activities pursuant to the Energy Policy Act, Coastal Zone Management Act, Magnuson-Stevens Fishery Conservation and Management Act, National Environmental Policy Act, Rivers and Harbors Act and the Submerged Lands Act.
Hawai'i
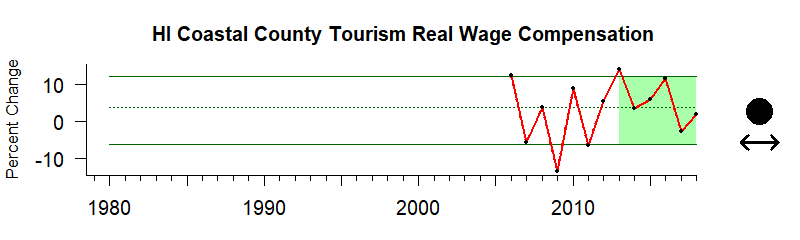
Values correspond to percent change in the total real wage compensation of the Tourism Sector of Coastal Counties in US States that border a region
Description of Time Series: Between 2014 and 2018 the average change in coastal county real wage compensation showed no significant trend.
Description of Gauge: Between 2014 and 2018 the average change in coastal county tourism sector real wage compensation was higher than the median change in coastal county tourism sector real wage compensation between 2006 and 2018.
Extreme Gauge values:
A value of zero on the gauge means that the average coastal tourism wage compensation over the last 5 years of data was below any annual coastal tourism wage compensation level up until that point, while a value of 100 would indicate the average over that same period was above any annual coastal tourism wage compensation level up until that point.
Indicator Source Information:
Coastal tourism wage is the measure of wages (nominal) paid to employees in tourism industries along the coast. Data for Coastal Counties come from the US Census Bureau. This dataset represents US counties and independent cities which have at least one coastal border and select non-coastal counties and independent cities based on proximity to estuaries and other coastal counties. The dataset is built to support coastal and ocean planning and other activities pursuant to the Energy Policy Act, Coastal Zone Management Act, Magnuson-Stevens Fishery Conservation and Management Act, National Environmental Policy Act, Rivers and Harbors Act and the Submerged Lands Act.
Northeast US
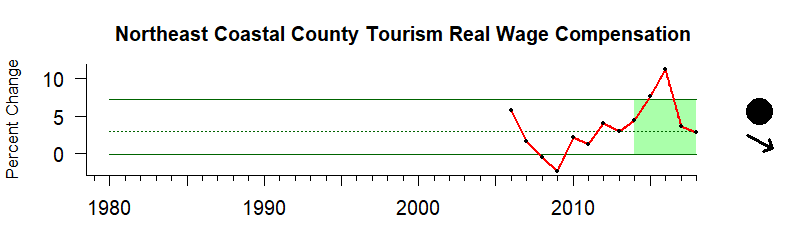
Values correspond to percent change in the total real wage compensation of the Tourism Sector of Coastal Counties in US States that border a region
Description of Time Series: Between 2014 and 2018 the average change in coastal county real wage compensation showed no significant trend.
Description of Gauge: Between 2014 and 2018 the average change in coastal county tourism sector real wage compensation was much higher than the median change in coastal county tourism sector real wage compensation between 2006 and 2018.
Extreme Gauge values:
A value of zero on the gauge means that the average coastal tourism wage compensation over the last 5 years of data was below any annual coastal tourism wage compensation level up until that point, while a value of 100 would indicate the average over that same period was above any annual coastal tourism wage compensation level up until that point.
Indicator Source Information:
Coastal tourism wage is the measure of wages (nominal) paid to employees in tourism industries along the coast. Data for Coastal Counties come from the US Census Bureau. This dataset represents US counties and independent cities which have at least one coastal border and select non-coastal counties and independent cities based on proximity to estuaries and other coastal counties. The dataset is built to support coastal and ocean planning and other activities pursuant to the Energy Policy Act, Coastal Zone Management Act, Magnuson-Stevens Fishery Conservation and Management Act, National Environmental Policy Act, Rivers and Harbors Act and the Submerged Lands Act.
Southeast US
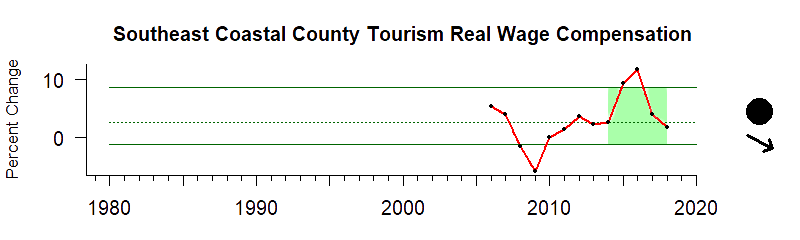
Values correspond to percent change in the total real wage compensation of the Tourism Sector of Coastal Counties in US States that border a region
Description of Time Series: Between 2014 and 2018 the average change in coastal county real wage compensation showed no significant trend.
Description of Gauge: Between 2014 and 2018 the average change in coastal county tourism sector real wage compensation was much higher than the median change in coastal county tourism sector real wage compensation between 2006 and 2018
Extreme Gauge values:
A value of zero on the gauge means that the average coastal tourism wage compensation over the last 5 years of data was below any annual coastal tourism wage compensation level up until that point, while a value of 100 would indicate the average over that same period was above any annual coastal tourism wage compensation level up until that point.
Indicator Source Information:
Coastal tourism wage is the measure of wages (nominal) paid to employees in tourism industries along the coast. Data for Coastal Counties come from the US Census Bureau. This dataset represents US counties and independent cities which have at least one coastal border and select non-coastal counties and independent cities based on proximity to estuaries and other coastal counties. The dataset is built to support coastal and ocean planning and other activities pursuant to the Energy Policy Act, Coastal Zone Management Act, Magnuson-Stevens Fishery Conservation and Management Act, National Environmental Policy Act, Rivers and Harbors Act and the Submerged Lands Act.

Resources
Professional Association of Diving Instructors (PADI)
The Professional Association of Diving Instructors (PADI) is a recreational diving membership and diver training organization

Regional Economy of Fisheries (GDP) and Percent Regional Economy Dependent on Fisheries: National Ocean Economics Program
Ocean Economy data include only ocean related activities and industries compiled from the databases of the Bureau of Labor Statistics. Data for the years 1990 to 2004 were generated by the National Ocean Economics Program. Data for all years beyond 2004 were generated by the NOAA Coastal Services Center. To access Coastal Economy data, which contain all sectors and industries of the coastal states, see Coastal Economy Data.

Regional Economy of Fisheries (Number of Establishments, Employments) and Percent Regional Economy Dependent on Fisheries: National Ocean Economics Program:
Ocean Economy data include only ocean related activities and industries compiled from the databases of the Bureau of Labor Statistics. Data for the years 1990 to 2004 were generated by the National Ocean Economics Program. Data for all years beyond 2004 were generated by the NOAA Coastal Services Center. To access Coastal Economy data, which contain all sectors and industries of the coastal states, see Coastal Economy Data.

Inventory of Coastal Recreation and Tourism Data
As more communities turn to tourism for economic development, it becomes crucial to develop a sustainable tourism industry that enhances both communities and the environment. The NOAA Office for Coastal Management partnered with the Eastern Research Group to create an inventory of national and select state-level data on social and economic impacts of recreation and tourism, as well as associated environmental information on the impacts on natural resources. States included within the inventory are California, Florida, Hawaii, Massachusetts, North Carolina, and Ohio.

NOAA Economic National Ocean Watch data base
The Economics: National Ocean Watch (ENOW) data set features time-series data focused on the six economic sectors that are dependent on the oceans and Great Lakes. ENOW is available for counties, states, regions, and the nation in a wide variety of formats.