Description of forage fish:
Forage fish or otherwise known as small pelagics are fish and invertebrates (like squids) that inhabit - the pelagic zone - the open ocean. The number and distribution of pelagic fish vary regionally, depending on multiple physical and ecological factors i.e. the availability of light, nutrients, dissolved oxygen, temperature, salinity, predation, abundance of phytoplankton and zooplankton, etc. Small pelagics are known to exhibit “boom and bust” cycles of abundance in response to these conditions. Examples include anchovies, sardines, shad, menhaden and the fish that feed on them.
Small pelagic species are often important to fisheries and serve as forage for commercially and recreationally important fish, as well as other ecosystem species (e.g. seabirds and marine mammals). They are a critical part of marine food webs and important to monitor because so many other organisms depend on them. We present the annual total biomass of small pelagics/forage fish in the Alaska, California Current, and Northeast regions, as well as selected taxa in the Gulf of Mexico and Southeast regions.
Data:
Data for forage fish and small pelagics were obtained from regional NOAA Integrated Ecosystem Assessment Program teams that produce indicators and Ecosystem Status Reports. For more information https://www.integratedecosystemassessment.noaa.gov/
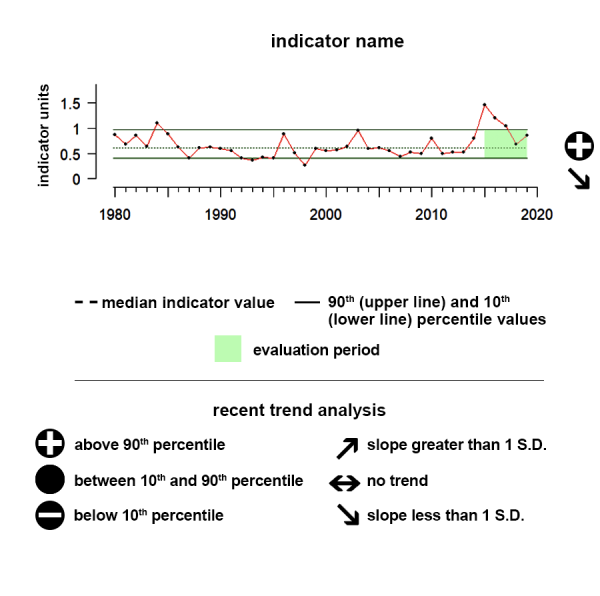
Understanding the Time series plots
Time series plots show the changes in each indicator as a function of time, over the period 1980-present. Each plot also shows horizontal lines that indicate the median (middle) value of that indicator, as well as the 10th and 90th percentiles, each calculated for the entire period of measurement. Time series plots were only developed for datasets with at least 10 years of data. Two symbols located to the right of each plot describe how recent values of an indicator compare against the overall series. A black circle indicates whether the indicator values over the last five years are on average above the series 90th percentile (plus sign), below the 10th percentile (minus sign), or between those two values (solid circle). Beneath that an arrow reflects the trend of the indicator over the last five years; an increase or decrease greater than one standard deviation is reflected in upward or downward arrows respectively, while a change of less than one standard deviation is recorded by a left-right arrow.
Alaska
Forage fish
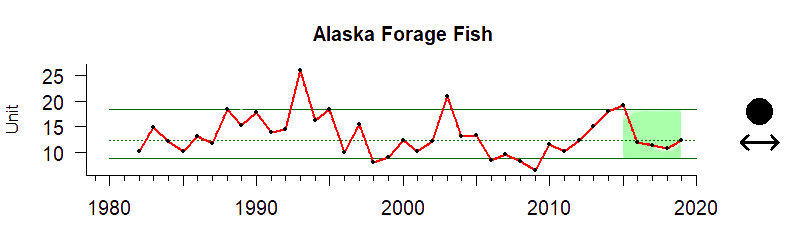
Values correspond to estimated total forage biomass in millions of tons
Time series: Between 2015 and 2019 the biomass of forage fish showed a significant downward trend.
Gauge: Gauge value of 58 indicates that between 2015 and 2019 the biomass of forage fish in Alaska was greater than the median value of all forage fish biomass between 1992 and 2019.
Gauge values
0 - 10: The five-year forage fish small pelagics average is very low compared to the median value.
10 - 25: The five-year forage fish small pelagics average is much lower than the median value.
25 - 50: The five-year forage fish small pelagics average is lower than the median value.
50: The five-year forage fish small pelagics average equals the median value.
50 - 75: The five-year forage fish small pelagics average is higher than the median value.
75 - 90: The five-year forage fish small pelagics average is much higher than the median value.
Indicator information:
Forage fish or otherwise known as small pelagics are fish and invertebrates (like squids) that inhabit - the pelagic zone - the open ocean. Small pelagic species are often important to fisheries and serve as forage for commercially and recreationally important fish, as well as other ecosystem species (e.g. seabirds and marine mammals). The number and distribution of pelagic fish vary regionally, depending on multiple physical and ecological factors (i.e., the availability of light, nutrients, dissolved oxygen, temperature, salinity, predation, abundance of phytoplankton and zooplankton, etc.). Small pelagics are known to exhibit “boom and bust” cycles of abundance in response to these conditions. Examples include anchovies, sardines, shad, menhaden and the fish that feed on them.
This indicator from the Gulf of Alaska Integrated Ecosystem Assessment Program’s East Bering Sea (EBS) team includes adult and juvenile pollock, other forage fish such as herring, capelin, eulachon, and sandlance, pelagic rockfish, salmon, and squid.
Data background and caveats:
Units, time series, and species vary by region for this indicator, so no national score is provided. Best practices and caveats vary by region:
Information quality for this indicator ranges from a sophisticated highly quantitative stock assessment for pollock (the biomass dominant in the guild) through relatively high variance EBS shelf survey data for forage fish, to no time series data for salmon and squid.
California Current
Forage fish
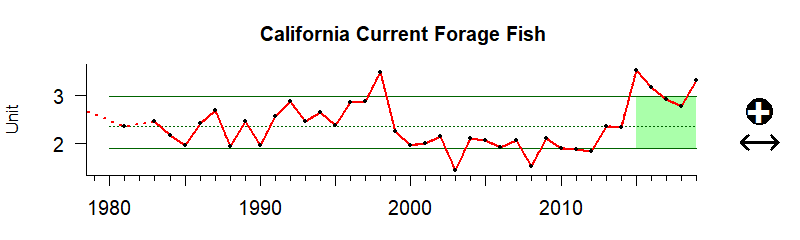
Values correspond to relative coolwater forage abundance index score
Time series: Between 2015 and 2019 the biomass of forage fish showed no significant trend.
Description of gauge: The gauge value of 90 indicates that between 2015 and 2019 the biomass of forage fish (CPUE) in the California Current region was much greater than the median value of all forage fish biomass between 1992 and 2019
Gauge values
0 - 10: The five-year forage fish small pelagics average is very low compared to the median value.
10 - 25: The five-year forage fish small pelagics average is much lower than the median value.
25 - 50: The five-year forage fish small pelagics average is lower than the median value.
50: The five-year forage fish small pelagics average equals the median value.
50 - 75: The five-year forage fish small pelagics average is higher than the median value.
75 - 90: The five-year forage fish small pelagics average is much higher than the median value.
90 - 100: The five-year forage fish small pelagics average is very high compared to the median value.
Indicator information:
Forage fish or otherwise known as small pelagics are fish and invertebrates (like squids) that inhabit - the pelagic zone - the open ocean. Small pelagic species are often important to fisheries and serve as forage for commercially and recreationally important fish, as well as other ecosystem species (e.g. seabirds and marine mammals). The number and distribution of pelagic fish vary regionally, depending on multiple physical and ecological factors (i.e., the availability of light, nutrients, dissolved oxygen, temperature, salinity, predation, abundance of phytoplankton and zooplankton, etc.). Small pelagics are known to exhibit “boom and bust” cycles of abundance in response to these conditions. Examples include anchovies, sardines, shad, menhaden and the fish that feed on them.
This indicator is produced by the California Current Integrated Ecosystem Assessment team and includes the following species: larval anchovy (Engraulis mordax); coolwater larval fish (NA, multi-species); warmwater larval fish (NA, multi-species); larval hake (Merluccius productus); larval market squid (Doryteuthis opalescens); larval pac jack mackerel (Trachurus symmetricus); larval sanddab (Citharichthys spp.); larval sardine (Sardinops sagax); larval shortbelly rockfish (Sebastes jordani)
Data background and caveats:
Units, time series, and species vary by region for this indicator, so no national score is provided. Best practices and caveats vary by region:
This indicator only includes data from surveys of the southern extent of the California Current region in the Spring. Index calculations are as follows: Larval fish data summed across all stations of the CalCOFI survey in spring (units are in number under 10 sq. m of surface area; ln(abundance+1)).
Gulf of Mexico
Menhaden biomass
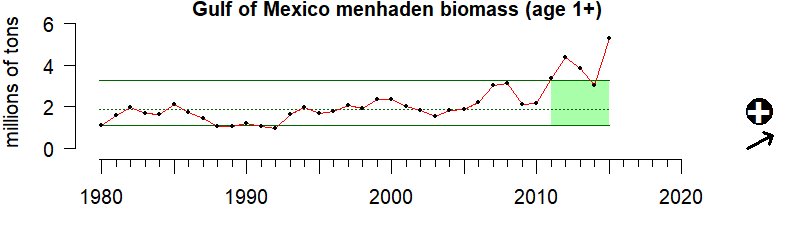
Values correspond to estimated menhaden forage biomass in millions of tons
Description of time series: Between 2011 and 2015 the biomass of Menhaden forage fish showed a significant upward trend.
Description of gauge: The gauge value of 94 indicates that between 2011 and 2015 the biomass of Menhaden forage fish in the Gulf Of Mexico was much greater than the median value of all Menhaden forage fish biomass between 1980 and 2015
Gauge values
0 - 10: The five-year forage fish small pelagics average is very low compared to the median value.
10 - 25: The five-year forage fish small pelagics average is much lower than the median value.
25 - 50: The five-year forage fish small pelagics average is lower than the median value.
50: The five-year forage fish small pelagics average equals the median value.
50 - 75: The five-year forage fish small pelagics average is higher than the median value.
75 - 90: The five-year forage fish small pelagics average is much higher than the median value.
90 - 100: The five-year forage fish small pelagics average is very high compared to the median value.
Indicator information:
Forage fish or otherwise known as small pelagics are fish and invertebrates (like squids) that inhabit - the pelagic zone - the open ocean. Small pelagic species are often important to fisheries and serve as forage for commercially and recreationally important fish, as well as other ecosystem species (e.g. seabirds and marine mammals). The number and distribution of pelagic fish vary regionally, depending on multiple physical and ecological factors (i.e., the availability of light, nutrients, dissolved oxygen, temperature, salinity, predation, abundance of phytoplankton and zooplankton, etc.). Small pelagics are known to exhibit “boom and bust” cycles of abundance in response to these conditions. Examples include anchovies, sardines, shad, menhaden and the fish that feed on them.
This indicator, produced by the Gulf of Mexico Integrated Ecosystem Assessment team, is an index of menhaden (Brevoortia tyrannus) biomass derived from the stock assessment, serving as a potential indicator of the amount of forage available in the ecosystem. The species is thought to play a substantial role in ecosystem structure and function. Menhaden are assessed using an age-structured model, and stock biomass is reported for age-1 fish and above.
Data background and caveats:
Units, time series, and species vary by region for this indicator, so no national score is provided. Best practices and caveats vary by region:
This indicator represents an estimated abundance of a single species and has not been updated since 2015.
Northeast
Planktivore biomass
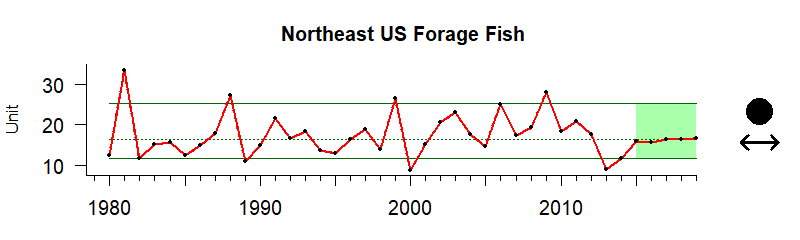
Values correspond to forage biomass observed per tow in kg
Time Series: Between 2015 and 2019 the biomass of forage fish showed no significant trend.
Description of Gauge: The Gauge value of 45 indicates that between 2015 and 2019 the biomass of spring planktivore forage fish was less than the median value of all spring planktivore forage fish biomass between 1980 and 2019.
Gauge values
0 - 10: The five-year forage fish small pelagics average is very low compared to the median value.
10 - 25: The five-year forage fish small pelagics average is much lower than the median value.
25 - 50: The five-year forage fish small pelagics average is lower than the median value.
50: The five-year forage fish small pelagics average equals the median value.
50 - 75: The five-year forage fish small pelagics average is higher than the median value.
75 - 90: The five-year forage fish small pelagics average is much higher than the median value.
90 - 100: The five-year forage fish small pelagics average is very high compared to the median value.
Indicator information:
Forage fish or otherwise known as small pelagics are fish and invertebrates (like squids) that inhabit - the pelagic zone - the open ocean. Small pelagic species are often important to fisheries and serve as forage for commercially and recreationally important fish, as well as other ecosystem species (e.g. seabirds and marine mammals). The number and distribution of pelagic fish vary regionally, depending on multiple physical and ecological factors (i.e., the availability of light, nutrients, dissolved oxygen, temperature, salinity, predation, abundance of phytoplankton and zooplankton, etc.). Small pelagics are known to exhibit “boom and bust” cycles of abundance in response to these conditions. Examples include anchovies, sardines, shad, menhaden and the fish that feed on them.
This indicator is produced by the Northeast Integrated Ecosystem Assessment team and represents Spring Planktivore biomass in kg^tow -1.
Data background and caveats:
Units, time series, and species vary by region for this indicator, so no national score is provided. Best practices and caveats vary by region.
No Caveats.
Southeast
Menhaden biomass
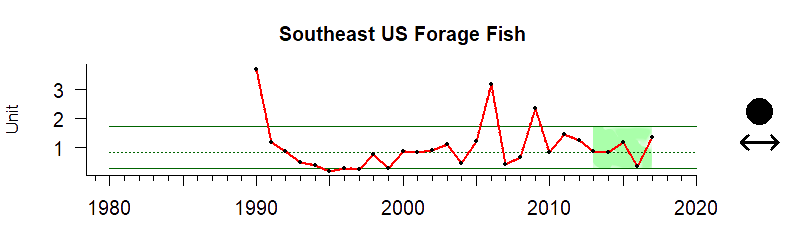
Values correspond to catch per unit effort index score
Time series: Between 2013 and 2017 the forage fish CPUE Index showed no significant trend.
Gauge: Gauge value of 64 indicates that between 2013 and 2017 the forage fish catch per unit effort index score in the Southeast was greater than the median value of all forage fish biomass between 1990 and 2017.
Gauge values
0 - 10: The five-year forage fish small pelagics average is very low compared to the median value.
10 - 25: The five-year forage fish small pelagics average is much lower than the median value.
25 - 50: The five-year forage fish small pelagics average is lower than the median value.
50: The five-year forage fish small pelagics average equals the median value.
50 - 75: The five-year forage fish small pelagics average is higher than the median value.
75 - 90: The five-year forage fish small pelagics average is much higher than the median value.
90 - 100: The five-year forage fish small pelagics average is very high compared to the median value.
Indicator information:
Forage fish or otherwise known as small pelagics are fish and invertebrates (like squids) that inhabit - the pelagic zone - the open ocean. Small pelagic species are often important to fisheries and serve as forage for commercially and recreationally important fish, as well as other ecosystem species (e.g. seabirds and marine mammals). The number and distribution of pelagic fish vary regionally, depending on multiple physical and ecological factors (i.e., the availability of light, nutrients, dissolved oxygen, temperature, salinity, predation, abundance of phytoplankton and zooplankton, etc.). Small pelagics are known to exhibit “boom and bust” cycles of abundance in response to these conditions. Examples include anchovies, sardines, shad, menhaden and the fish that feed on them.
The Southeast Atlantic forage indicator is the Menhaden CPUE Index score used by the Southeast Integrated Ecosystem Assessment team in their upcoming Ecosystem Status Report. Menhaden (Brevoortia tyrannus) are thought to play a substantial role in ecosystem structure and function. At the time of writing, the report is under review and data are not publicly available.
Data background and caveats:
Units, time series, and species vary by region for this indicator, so no national score is provided. Best practices and caveats vary by region.
No Caveats.

Resources
CalCOFI Small Pelagic Fish Management
The California Cooperative Oceanic Fisheries Investigations (CalCOFI) are a unique partnership of the California Department of Fish & Wildlife, NOAA Fisheries Service and Scripps Institution of Oceanography.

What are pelagic fish?
An explainer that defines what "pelagic fish" are from the National Ocean Service of NOAA
Northeast IEA Small Pelagic Indicator
Small-medium pelagic schooling fish and squid species are important to both fisheries and food webs. This group includes Atlantic herring, river herrings, Atlantic mackerel, butterfish, menhaden, and sandlance in the Northeast US. Forage fish in general can include any small pelagic plankton feeders, whether fished or unfished. Predation on forage fishes creates an important trophic link between the plankton and higher trophic levels. In the Northeast US, commercial fishing of all forage fishes combined contributes less to the removal of fish biomass than does natural predation on this category in aggregate. Regulating fishery catch for forage species is important to maintain both sustainable fisheries and predator populations. Commercial catches of Northeast US forage fish (Atlantic herring and mackerel) peaked in the 1970s, with lower catches since then, and surveys showing aggregate forage biomass increases from an early 1980s low.

Southwest Fisheries Science Center Coastal Pelagic Species
The Fisheries Resources Division conducts research on coastal pelagic and highly migratory marine species in the Eastern Pacific Ocean. They focus on the ecology, ecosystems, and fisheries of sardine, anchovy, mackerels, tunas, and sharks, as well as conduct research on abalone. Our programs collect fishery data, conduct stock assessments and economic analyses, conduct surveys on fish and invertebrate life stages using various advanced technologies, and study their genetic structure and aquaculture potential.

Gulf of Mexico Ecosystem Status Report data
GitHub portal for data sets and plotting codes for Gulf of Mexico Ecosystem Status Report
Alaska IEA Ecosystem Status Report
Ecosystem Status report information from the Alaska Integrated Ecosystem Assessment Program
