
Description of Sea Level:
Sea level varies due to the force of gravity, the Earth’s rotation and irregular features on the ocean floor. Other forces affecting sea levels include temperature, wind, ocean currents, tides, and other similar processes. With 40 percent of Americans living in densely populated coastal areas, having a clear understanding of sea level trends is critical to societal and economic well being.
Measuring and predicting sea levels, tides and storm surge are important for determining coastal boundaries, ensuring safe shipping, emergency preparedness, and other aspects of the well-being of coastal communities.
Data Source:
Sea level data presented here are measurements of relative sea level, water height as compared to nearby land level, from NOAA tide gauges that have >20 years of hourly data served through NOAA’s Center for Operational Oceanographic Products and Services (CO-OPS) Tides and Currents website.
Understanding the Time series plots
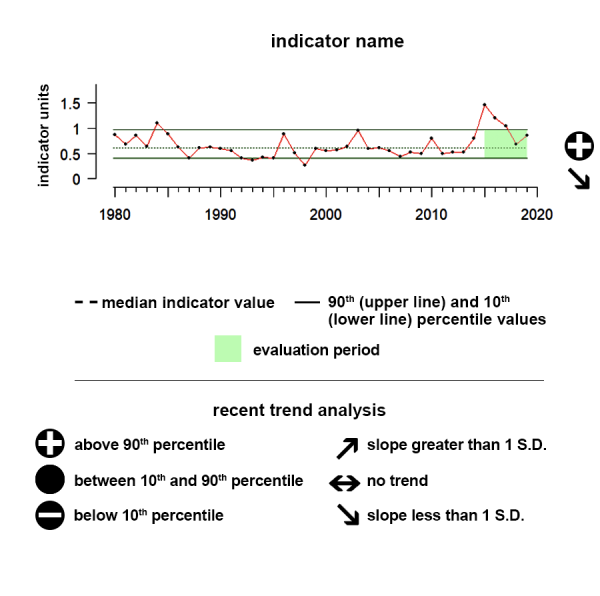
Time series plots show the changes in each indicator as a function of time, over the period 1980-present. Each plot also shows horizontal lines that indicate the median (middle) value of that indicator, as well as the 10th and 90th percentiles, each calculated for the entire period of measurement. Time series plots were only developed for datasets with at least 10 years of data. Two symbols located to the right of each plot describe how recent values of an indicator compare against the overall series. A black circle indicates whether the indicator values over the last five years are on average above the series 90th percentile (plus sign), below the 10th percentile (minus sign), or between those two values (solid circle). Beneath that an arrow reflects the trend of the indicator over the last five years; an increase or decrease greater than one standard deviation is reflected in upward or downward arrows respectively, while a change of less than one standard deviation is recorded by a left-right arrow.
Alaska
Chukchi and Beaufort Seas
Sea level varies due to the force of gravity, the Earth’s rotation and irregular features on the ocean floor. Other forces affecting sea levels include temperature, wind, ocean currents, tides, and other similar processes.
Description of time series:
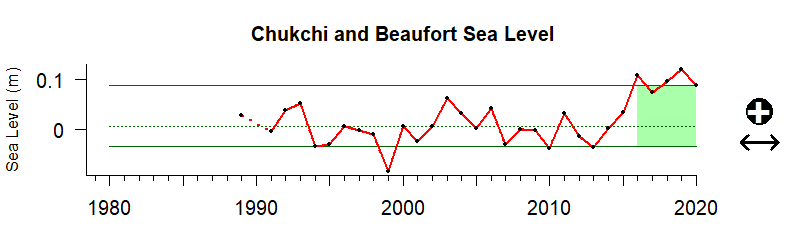
The time series shows the relative sea level for this region. During the last five years there has been a positive trend and while values have remained within the 10th and 90th percentiles, albeit near the higher range of time series values.
Description of gauge:
The gauge value of 94 indicates that the mean sea level between 2016 and 2020 for Northern Alaska’s Arctic Sea region was higher than 94% of the sea level between 1980 and 2020.
Indicator and source information:
NOAA monitors sea levels using tide stations and satellite laser altimeters. Tide stations around the globe tell us what is happening at local levels, while satellite measurements provide us with the average height of the entire ocean. Taken together, data from these sources are fed into models that tell us how our ocean sea levels are changing over time. For this site, data from tide stations around the US were combined to create regionally averaged records of sea-level change since 1980. We present data for all regions.
This indicator includes tide gauges from Nome and Prudhoe Bay, AK.
Data background and limitations:
Sea level data presented here are measurements of relative sea level, water height as compared to nearby land level, from NOAA tide gauges that have >20 years of hourly data served through NOAA’s Center for Operational Oceanographic Products and Services (CO-OPS) Tides and Currents website. These local measurements are regionally averaged by taking the median value of all the qualifying stations within a region. The measurements are in meters and are relative to the year 2000.
Alaska
Gulf of Alaska and Eastern Bering Sea
Sea level varies due to the force of gravity, the Earth’s rotation and irregular features on the ocean floor. Other forces affecting sea levels include temperature, wind, ocean currents, tides, and other similar processes.
Description of time series:
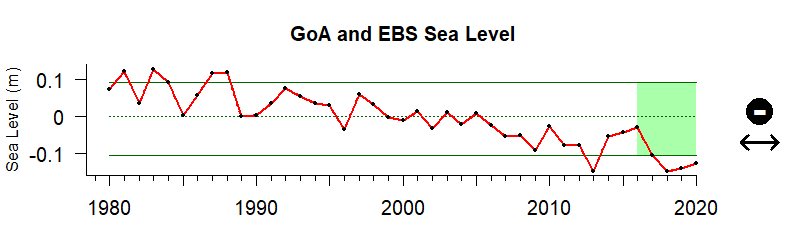
The time series shows the relative sea level, water height as compared to nearby land level, for the Southern Alaska region. During the last five years there has been no notable trend but values were below the 10th percentile of all observed data in the time series.
Description of gauge:
The gauge value of 10 indicates that the sea level between 2016 and 2020 for the Southern Alaska region was only higher than 10% of the sea level between 1980 and 2020.
Indicator and source information:
NOAA monitors sea levels using tide stations and satellite laser altimeters. Tide stations around the globe tell us what is happening at local levels, while satellite measurements provide us with the average height of the entire ocean. Taken together, data from these sources are fed into models that tell us how our ocean sea levels are changing over time. For this site, data from tide stations around the US were combined to create regionally averaged records of sea-level change since 1980. We present data for all regions.
This indicator includes tide gauges from Ketchikan, Sitka, Juneau, Skagway, Yakutat, Cordova, Valdez, Seward, Seldovia, Nikiski, Anchorage, Kodiak Island, Sand Point, Adak Island, Unalaska, and Port Moller, AK.
Data background and limitations:
Sea level data presented here are measurements of relative sea level, water height as compared to nearby land level, from NOAA tide gauges that have >20 years of hourly data served through NOAA’s Center for Operational Oceanographic Products and Services (CO-OPS) Tides and Currents website. These local measurements are regionally averaged by taking the median value of all the qualifying stations within a region. The measurements are in meters and are relative to the year 2000.
Hawai'i-Pacific Islands
Sea level varies due to the force of gravity, the Earth’s rotation and irregular features on the ocean floor. Other forces affecting sea levels include temperature, wind, ocean currents, tides, and other similar processes.
Description of time series:
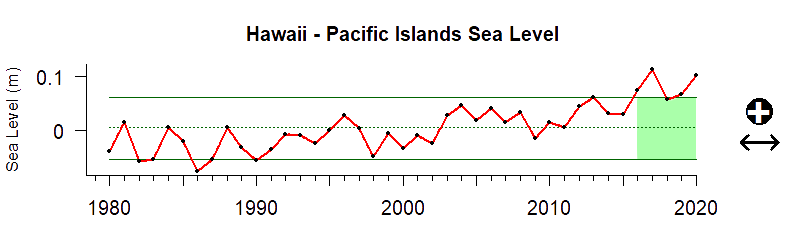
The time series shows the relative sea level, water height as compared to nearby land level, for the Hawai‘i–Pacific Islands region. During the last five years there has been no notable trend but values were above the 90th percentile of all observed data in the time series.
Description of gauge:
The gauge value of 95 indicates that the sea level between 2016 and 2020 for the Hawai‘i–Pacific Islands region was higher than 95% of the sea level between 1980 and 2020.
Indicator and source information:
NOAA monitors sea levels using tide stations and satellite laser altimeters. Tide stations around the globe tell us what is happening at local levels, while satellite measurements provide us with the average height of the entire ocean. Taken together, data from these sources are fed into models that tell us how our ocean sea levels are changing over time. For this site, data from tide stations around the US were combined to create regionally averaged records of sea-level change since 1980. We present data for all regions.
Data background and limitations:
Sea level data presented here are measurements of relative sea level, water height as compared to nearby land level, from NOAA tide gauges that have >20 years of hourly data served through NOAA’s Center for Operational Oceanographic Products and Services (CO-OPS) Tides and Currents website. These local measurements are regionally averaged by taking the median value of all the qualifying stations within a region. The measurements are in meters and are relative to the year 2000.
California Current
Sea level varies due to the force of gravity, the Earth’s rotation and irregular features on the ocean floor. Other forces affecting sea levels include temperature, wind, ocean currents, tides, and other similar processes.
Description of time series:
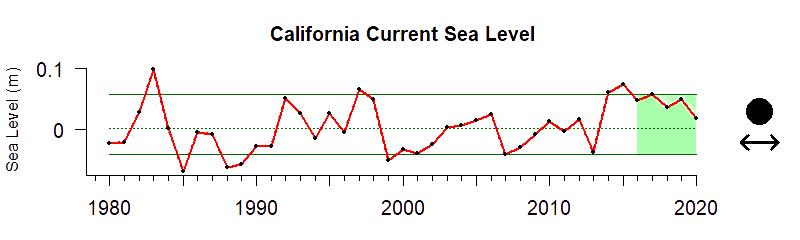
The time series shows the relative sea level, water height as compared to nearby land level, for the California Current region. During the last five years there has been no notable trend and values have remained within the 10th and 90th percentiles of all observed data in the time series.
Description of gauge:
The gauge value of 78 indicates that the sea level between 2016 and 2020 for the California Current region was higher than 78% of the sea level between 1980 and 2020.
Indicator and source information:
NOAA monitors sea levels using tide stations and satellite laser altimeters. Tide stations around the globe tell us what is happening at local levels, while satellite measurements provide us with the average height of the entire ocean. Taken together, data from these sources are fed into models that tell us how our ocean sea levels are changing over time. For this site, data from tide stations around the US were combined to create regionally averaged records of sea-level change since 1980. We present data for all regions.
Data background and limitations:
Sea level data presented here are measurements of relative sea level, water height as compared to nearby land level, from NOAA tide gauges that have >20 years of hourly data served through NOAA’s Center for Operational Oceanographic Products and Services (CO-OPS) Tides and Currents website. These local measurements are regionally averaged by taking the median value of all the qualifying stations within a region. The measurements are in meters and are relative to the year 2000.
Gulf of Mexico
Sea level varies due to the force of gravity, the Earth’s rotation and irregular features on the ocean floor. Other forces affecting sea levels include temperature, wind, ocean currents, tides, and other similar processes.
Description of time series:
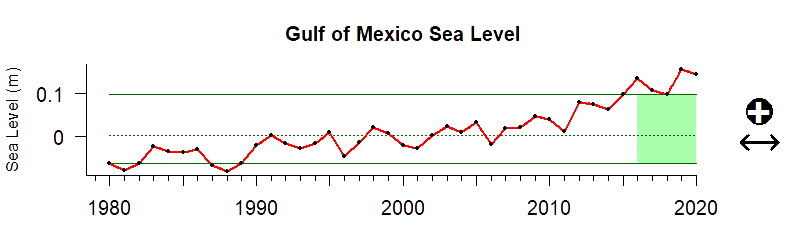
The time series shows the relative sea level, water height as compared to nearby land level, for the Gulf of Mexico region. During the last five years there has been no notable trend but values were above the 90th percentile of all observed data in the time series.
Description of gauge:
The gauge value of 93 indicates that the sea level between 2016 and 2020 for the Gulf of Mexico region was higher than 93% of the sea level between 1980 and 2020.
Indicator and source information:
NOAA monitors sea levels using tide stations and satellite laser altimeters. Tide stations around the globe tell us what is happening at local levels, while satellite measurements provide us with the average height of the entire ocean. Taken together, data from these sources are fed into models that tell us how our ocean sea levels are changing over time. For this site, data from tide stations around the US were combined to create regionally averaged records of sea-level change since 1980. We present data for all regions.
Data background and limitations:
Sea level data presented here are measurements of relative sea level, water height as compared to nearby land level, from NOAA tide gauges that have >20 years of hourly data served through NOAA’s Center for Operational Oceanographic Products and Services (CO-OPS) Tides and Currents website. These local measurements are regionally averaged by taking the median value of all the qualifying stations within a region. The measurements are in meters and are relative to the year 2000.
Caribbean
Sea level varies due to the force of gravity, the Earth’s rotation and irregular features on the ocean floor. Other forces affecting sea levels include temperature, wind, ocean currents, tides, and other similar processes.
Description of time series:
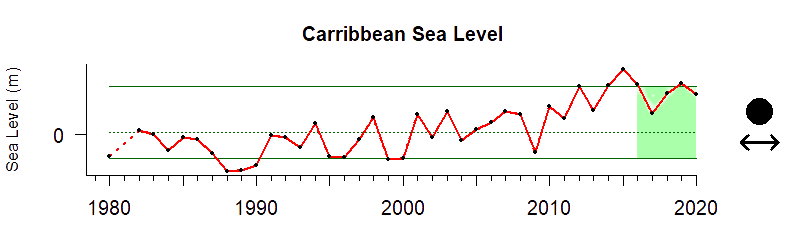
The time series shows the relative sea level, water height as compared to nearby land level, for the Caribbean region. During the last five years there has been no notable trend and values have remained within the 10th and 90th percentiles of all observed data in the time series.
Description of gauge:
The gauge value of 85 indicates that the sea level between 2016 and 2020 for the Caribbean region was higher than 85% of the sea level between 1980 and 2020.
Indicator and source information:
NOAA monitors sea levels using tide stations and satellite laser altimeters. Tide stations around the globe tell us what is happening at local levels, while satellite measurements provide us with the average height of the entire ocean. Taken together, data from these sources are fed into models that tell us how our ocean sea levels are changing over time. For this site, data from tide stations around the US were combined to create regionally averaged records of sea-level change since 1980. We present data for all regions.
Data background and limitations:
Sea level data presented here are measurements of relative sea level, water height as compared to nearby land level, from NOAA tide gauges that have >20 years of hourly data served through NOAA’s Center for Operational Oceanographic Products and Services (CO-OPS) Tides and Currents website. These local measurements are regionally averaged by taking the median value of all the qualifying stations within a region. The measurements are in meters and are relative to the year 2000.
Southeast
Sea level varies due to the force of gravity, the Earth’s rotation and irregular features on the ocean floor. Other forces affecting sea levels include temperature, wind, ocean currents, tides, and other similar processes.
Description of time series:
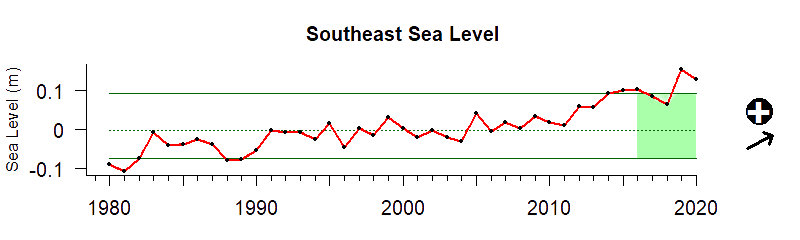
The time series shows the relative sea level, water height as compared to nearby land level, for the Southeast US region. During the last five years there has been a significant upward trend and values were above the 90th percentile of all observed data in the time series.
Description of gauge:
The gauge value of 95 indicates that the sea level between 2016 and 2020 for the Southeast US region was higher than 95% of the sea level between 1980 and 2020.
Indicator and source information:
NOAA monitors sea levels using tide stations and satellite laser altimeters. Tide stations around the globe tell us what is happening at local levels, while satellite measurements provide us with the average height of the entire ocean. Taken together, data from these sources are fed into models that tell us how our ocean sea levels are changing over time. For this site, data from tide stations around the US were combined to create regionally averaged records of sea-level change since 1980. We present data for all regions.
Data background and limitations:
Sea level data presented here are measurements of relative sea level, water height as compared to nearby land level, from NOAA tide gauges that have >20 years of hourly data served through NOAA’s Center for Operational Oceanographic Products and Services (CO-OPS) Tides and Currents website. These local measurements are regionally averaged by taking the median value of all the qualifying stations within a region. The measurements are in meters and are relative to the year 2000.
Northeast
Sea level varies due to the force of gravity, the Earth’s rotation and irregular features on the ocean floor. Other forces affecting sea levels include temperature, wind, ocean currents, tides, and other similar processes.
Description of time series:
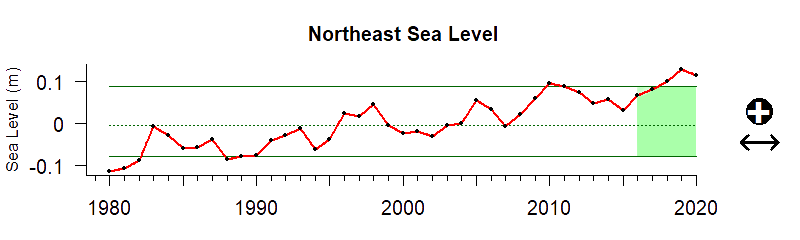
The time series shows the relative sea level, water height as compared to nearby land level, for the Northeast US region. During the last five years there has been no notable trend while but were above the 90th percentile of all observed data in the time series.
Description of gauge:
The gauge value of 93 indicates that the sea level between 2016 and 2020 for the Northeast US region was higher than 93% of the sea level between 1980 and 2020.
Indicator and source information:
NOAA monitors sea levels using tide stations and satellite laser altimeters. Tide stations around the globe tell us what is happening at local levels, while satellite measurements provide us with the average height of the entire ocean. Taken together, data from these sources are fed into models that tell us how our ocean sea levels are changing over time. For this site, data from tide stations around the US were combined to create regionally averaged records of sea-level change since 1980. We present data for all regions.
Data background and limitations:
Sea level data presented here are measurements of relative sea level, water height as compared to nearby land level, from NOAA tide gauges that have >20 years of hourly data served through NOAA’s Center for Operational Oceanographic Products and Services (CO-OPS) Tides and Currents website. These local measurements are regionally averaged by taking the median value of all the qualifying stations within a region. The measurements are in meters and are relative to the year 2000.

Resources
Sea Level Rise Viewer
Use this web mapping tool to visualize community-level impacts from coastal flooding or sea level rise (up to 10 feet above average high tides). Photo simulations of how future flooding might impact local landmarks are also provided, as well as data related to water depth, connectivity, flood frequency, socio-economic vulnerability, wetland loss and migration, and mapping confidence.

Sea Level Rise Data Download
The Digital Coast was developed to meet the unique needs of the coastal management community. The website provides not only coastal data, but also the tools, training, and information needed to make these data truly useful. Content comes from many sources, all of which are vetted by NOAA.
Data sets range from economic data to satellite imagery. The site contains visualization tools, predictive tools, and tools that make data easier to find and use. Training courses are available online or can be brought to the user’s location. Information is also organized by focus area or topic.

Sea Level Trends
The sea level trends measured by tide gauges that are presented here are local relative sea level (RSL) trends as opposed to the global sea level trend. Tide gauge measurements are made with respect to a local fixed reference on land. RSL is a combination of the sea level rise and the local vertical land motion. The global sea level trend has been recorded by satellite altimeters since 1992 and the latest global trend can be obtained from NOAA's Laboratory for Satellite Altimetry, with maps of the regional variation in the trend. The University of Colorado's Sea Level Research Group compares global sea level rates calculated by different research organizations and discusses some of the issues involved.

Global Climate Indicators
NOAA Climate.gov is a source of timely and authoritative scientific data and information about climate. Our goals are to promote public understanding of climate science and climate-related events, to make our data products and services easy to access and use, to provide climate-related support to the private sector and the Nation’s economy, and to serve people making climate-related decisions with tools and resources that help them answer specific questions.

Climate Change Indicators in the US (4th Edition)
EPA partners with more than 40 data contributors from various government agencies, academic institutions, and other organizations to compile a key set of indicators related to the causes and effects of climate change. The indicators are published in EPA's report, Climate Change Indicators in the United States, available on this website and in print. Explore the indicators below.