Description of Marine Species Distribution (Latitude and Depth):
The geographic location where a species is found, known as that species’ “distribution”, is a fundamental piece of information. Some species naturally move from location to location throughout the year, following seasons, food, or other factors. However, as climate change causes ocean waters to warm, populations of many species are moving towards the poles (northward in the northern hemisphere) or deeper towards cooler waters, allowing them to track their preferred temperature. Changes in a species distribution are not always due to individual animals following a preferred temperature, but could also be due to reduced survival of individuals in the warming areas. Understanding where and how fast marine species are moving is important to coastal communities as these changing distributions can affect the species available for fishing, recreation, and cultural practices. Marine species distributions are also good indicators of a warming ocean as they largely follow the species’ preferred temperature, can react quickly to ocean changes, and have been measured for many years, allowing us to see changes over time.
Data Source:
The marine species distribution data shown here is the average “centroid”, or mean location (as either latitude or depth) of the species weighted by biomass, of a large number of species from a region. These centroids are calculated by Ocean Adapt using data gathered by NOAA’s National Marine Fisheries Service (NMFS), and other agencies. NMFS monitors marine species populations by conducting annual bottom trawl surveys, some of which have been conducted for over 40 years.
Click on a region for more information about the data, timeseries, and gauges.
Marine Species Distribution changes in Latitude
Alaska
Eastern Bering Sea
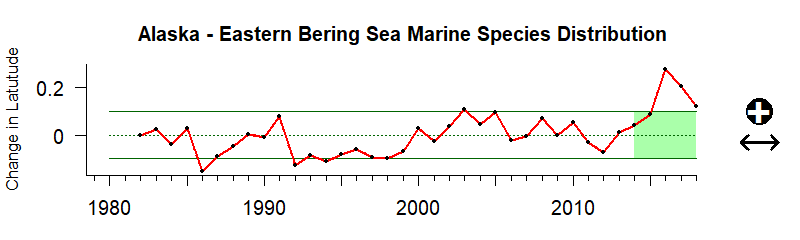
Values indicate annual cumulative change in centroid across all species in a region in degrees N
Description of Time Series: Between 2014 and 2018 the average species latitudinal shift showed no significant trend but remained much higher than historical values.
Description of Gauge: The gauge value of 95 indicates that between 2014 and 2018 the average species latitudinal shift was very high compared to the median average latitudinal shift between 1981 and 2018
Gauge Values
- 0 - 10: The five-year latitudinal shift is very low compared to the median value.
- 10 - 25: The five-year latitudinal shift is much lower than the median value.
- 25 - 50: The five-year latitudinal shift is lower than the median value.
- 50: The five-year latitudinal shift average equals the median value.
- 50 - 75: The five-year latitudinal shift is higher than the median value.
- 75 - 90: The five-year latitudinal shift is much higher than the median value.
- 90 - 100: The five-year latitudinal shift is very high compared to the median value
Indicator Source Information:
This data provides important information for fisheries management including which species are caught where and at what depth. The scientists at Ocean Adapt use this data to calculate each species’ centroid as the mean latitude and depth of catch in the survey, weighted by biomass. The centroid for each species is calculated for each year after standardizing the data to ensure that the measure is consistent over time despite changes in survey techniques and total area surveyed. A northern change in the centroid of latitude could result from the expansion of the northern edge of a species range, the contraction of the southern edge of a species range, or both.
Data Background and Caveats:
The regional and national marine species distributions shown here represent the average shift in the centroid of species caught in surveys conducted in each region. These species represent a wide range of habitats and species types. As species distributions respond to many environmental and biological factors, combining data from multiple diverse species allows for a more complete picture of the general trends in marine species distribution. In order to more easily track and display changes in these distributions, the first year is standardized to zero. Thus, the indicator represents relative change in distribution from the first survey year.
Alaska
Gulf of Alaska
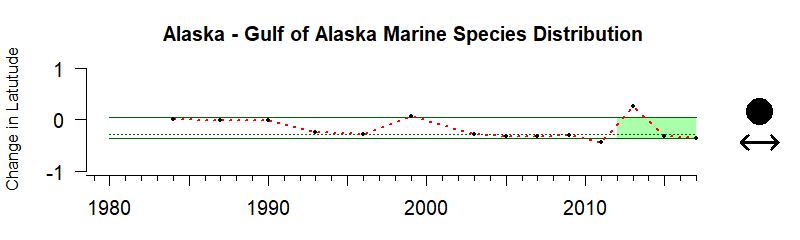
Values indicate annual cumulative change in centroid across all species in a region in degrees N
Description of Time Series: Between 2013 and 2017 the average species latitudinal shift shows no significant trend.
Description of Gauge: The gauge value of 64 indicates that between 2013 and 2017 the average species latitudinal shift was higher than the median average latitudinal shift between 1984 and 2017.
Gauge Values
- 0 - 10: The five-year latitudinal shift is very low compared to the median value.
- 10 - 25: The five-year latitudinal shift is much lower than the median value.
- 25 - 50: The five-year latitudinal shift is lower than the median value.
- 50: The five-year latitudinal shift average equals the median value.
- 50 - 75: The five-year latitudinal shift is higher than the median value.
- 75 - 90: The five-year latitudinal shift is much higher than the median value.
- 90 - 100: The five-year latitudinal shift is very high compared to the median value
Indicator Source Information:
This data provides important information for fisheries management including which species are caught where and at what depth. The scientists at Ocean Adapt use this data to calculate each species’ centroid as the mean latitude and depth of catch in the survey, weighted by biomass. The centroid for each species is calculated for each year after standardizing the data to ensure that the measure is consistent over time despite changes in survey techniques and total area surveyed. A northern change in the centroid of latitude could result from the expansion of the northern edge of a species range, the contraction of the southern edge of a species range, or both.
Data Background and Caveats:
The regional and national marine species distributions shown here represent the average shift in the centroid of species caught in surveys conducted in each region. These species represent a wide range of habitats and species types. As species distributions respond to many environmental and biological factors, combining data from multiple diverse species allows for a more complete picture of the general trends in marine species distribution. In order to more easily track and display changes in these distributions, the first year is standardized to zero. Thus, the indicator represents relative change in distribution from the first survey year.
Gulf of Mexico
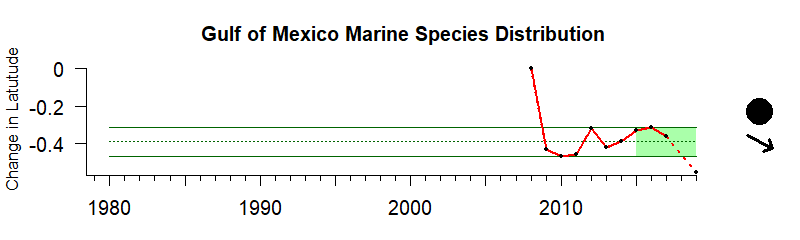
Values indicate annual cumulative change in centroid across all species in a region in degrees N
Description of Time Series: Between 2015 and 2019 the average species latitudinal shift shows a decreasing trend, indicating a southward shift in distributions.
Description of Gauge: The gauge value of 45 indicates that between 2015 and 2019 the average species latitudinal shift was lower than the median average latitudinal shift between 2008 and 2019.
Gauge Values
- 0 - 10: The five-year latitudinal shift is very low compared to the median value.
- 10 - 25: The five-year latitudinal shift is much lower than the median value.
- 25 - 50: The five-year latitudinal shift is lower than the median value.
- 50: The five-year latitudinal shift average equals the median value.
- 50 - 75: The five-year latitudinal shift is higher than the median value.
- 75 - 90: The five-year latitudinal shift is much higher than the median value.
- 90 - 100: The five-year latitudinal shift is very high compared to the median value
Indicator Source Information:
This data provides important information for fisheries management including which species are caught where and at what depth. The scientists at Ocean Adapt use this data to calculate each species’ centroid as the mean latitude and depth of catch in the survey, weighted by biomass. The centroid for each species is calculated for each year after standardizing the data to ensure that the measure is consistent over time despite changes in survey techniques and total area surveyed. A northern change in the centroid of latitude could result from the expansion of the northern edge of a species range, the contraction of the southern edge of a species range, or both.
Data Background and Caveats:
The regional and national marine species distributions shown here represent the average shift in the centroid of species caught in surveys conducted in each region. These species represent a wide range of habitats and species types. As species distributions respond to many environmental and biological factors, combining data from multiple diverse species allows for a more complete picture of the general trends in marine species distribution. In order to more easily track and display changes in these distributions, the first year is standardized to zero. Thus, the indicator represents relative change in distribution from the first survey year.
Northeast
Spring
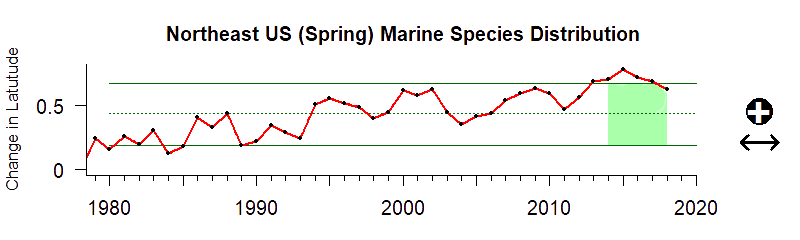
Values indicate annual cumulative change in centroid across all species in a region in degrees N
Description of Time Series: Between 2014 and 2018 the average species latitudinal shift showed no significant trend but remained much higher than historical values.
Description of Gauge: The gauge value of 93 indicates that between 2014 and 2018 the average species latitudinal shift was very high compared to the median average latitudinal shift between 1980 and 2018.
Gauge Values
- 0 - 10: The five-year latitudinal shift is very low compared to the median value.
- 10 - 25: The five-year latitudinal shift is much lower than the median value.
- 25 - 50: The five-year latitudinal shift is lower than the median value.
- 50: The five-year latitudinal shift average equals the median value.
- 50 - 75: The five-year latitudinal shift is higher than the median value.
- 75 - 90: The five-year latitudinal shift is much higher than the median value.
- 90 - 100: The five-year latitudinal shift is very high compared to the median value
Indicator Source Information:
This data provides important information for fisheries management including which species are caught where and at what depth. The scientists at Ocean Adapt use this data to calculate each species’ centroid as the mean latitude and depth of catch in the survey, weighted by biomass. The centroid for each species is calculated for each year after standardizing the data to ensure that the measure is consistent over time despite changes in survey techniques and total area surveyed. A northern change in the centroid of latitude could result from the expansion of the northern edge of a species range, the contraction of the southern edge of a species range, or both.
Data Background and Caveats:
The regional and national marine species distributions shown here represent the average shift in the centroid of species caught in surveys conducted in each region. These species represent a wide range of habitats and species types. As species distributions respond to many environmental and biological factors, combining data from multiple diverse species allows for a more complete picture of the general trends in marine species distribution. In order to more easily track and display changes in these distributions, the first year is standardized to zero. Thus, the indicator represents relative change in distribution from the first survey year.
Southeast
Spring
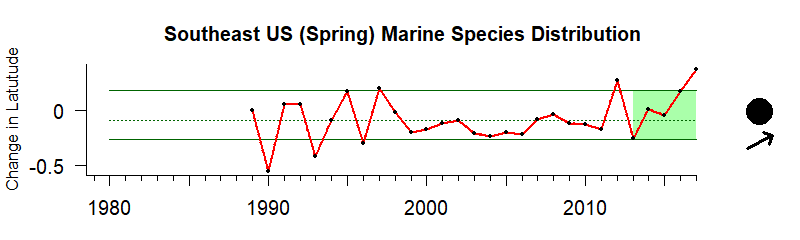
Values indicate annual cumulative change in centroid across all species in a region in degrees N
Description of Time Series: Between 2013 and 2017 the average species latitudinal shift showed an increasing trend, indicating a northward shift in distribution.
Description of Gauge: The gauge value of 76 indicates that between 2013 and 2017 the average species latitudinal shift was much higher than the median average latitudinal shift between 1989 and 2017.
Gauge Values
- 0 - 10: The five-year latitudinal shift is very low compared to the median value.
- 10 - 25: The five-year latitudinal shift is much lower than the median value.
- 25 - 50: The five-year latitudinal shift is lower than the median value.
- 50: The five-year latitudinal shift average equals the median value.
- 50 - 75: The five-year latitudinal shift is higher than the median value.
- 75 - 90: The five-year latitudinal shift is much higher than the median value.
- 90 - 100: The five-year latitudinal shift is very high compared to the median value
Indicator Source Information:
This data provides important information for fisheries management including which species are caught where and at what depth. The scientists at Ocean Adapt use this data to calculate each species’ centroid as the mean latitude and depth of catch in the survey, weighted by biomass. The centroid for each species is calculated for each year after standardizing the data to ensure that the measure is consistent over time despite changes in survey techniques and total area surveyed. A northern change in the centroid of latitude could result from the expansion of the northern edge of a species range, the contraction of the southern edge of a species range, or both.
Data Background and Caveats:
The regional and national marine species distributions shown here represent the average shift in the centroid of species caught in surveys conducted in each region. These species represent a wide range of habitats and species types. As species distributions respond to many environmental and biological factors, combining data from multiple diverse species allows for a more complete picture of the general trends in marine species distribution. In order to more easily track and display changes in these distributions, the first year is standardized to zero. Thus, the indicator represents relative change in distribution from the first survey year.
California Current
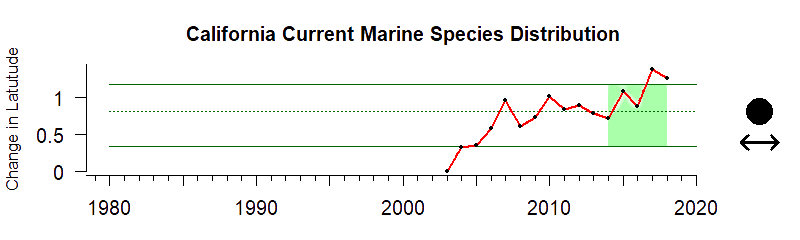
Values indicate annual cumulative change in centroid across all species in a region in degrees N
Description of Time Series: Between 2014 and 2018 the average species latitudinal shift showed no significant trend but remained much higher than historical values.
Description of Gauge: The gauge value of 81 indicates that between 2014 and 2018 the average species latitudinal shift was much higher than the median average latitudinal shift between 2003 and 2018.
Gauge Values
- 0 - 10: The five-year latitudinal shift is very low compared to the median value.
- 10 - 25: The five-year latitudinal shift is much lower than the median value.
- 25 - 50: The five-year latitudinal shift is lower than the median value.
- 50: The five-year latitudinal shift average equals the median value.
- 50 - 75: The five-year latitudinal shift is higher than the median value.
- 75 - 90: The five-year latitudinal shift is much higher than the median value.
- 90 - 100: The five-year latitudinal shift is very high compared to the median value
Indicator Source Information:
This data provides important information for fisheries management including which species are caught where and at what depth. The scientists at Ocean Adapt use this data to calculate each species’ centroid as the mean latitude and depth of catch in the survey, weighted by biomass. The centroid for each species is calculated for each year after standardizing the data to ensure that the measure is consistent over time despite changes in survey techniques and total area surveyed. A northern change in the centroid of latitude could result from the expansion of the northern edge of a species range, the contraction of the southern edge of a species range, or both.
Data Background and Caveats:
The regional and national marine species distributions shown here represent the average shift in the centroid of species caught in surveys conducted in each region. These species represent a wide range of habitats and species types. As species distributions respond to many environmental and biological factors, combining data from multiple diverse species allows for a more complete picture of the general trends in marine species distribution. In order to more easily track and display changes in these distributions, the first year is standardized to zero. Thus, the indicator represents relative change in distribution from the first survey year.
Marine Species Distribution Changes in Water Column Depth
Alaska
Eastern Bering Sea
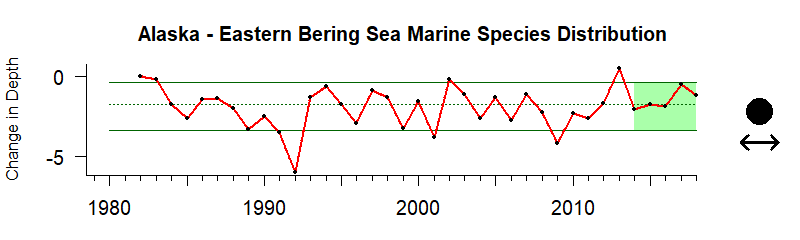
Values Indicate annual cumulative change in average species centroid depth in meters - for example, a value of -5 indicates the species centroid moving deeper by 5m.
Description of Time Series: Between 2014 and 2018 the average species water column depth shift showed no significant trend.
Description of Gauge: The gauge value of 59 indicates that between 2014 and 2018 the average species water column depth shift was higher than the median average water column depth shift between 1981 and 2018 with species moving towards the surface.
Gauge Values
- 0 - 10: The five-year water column depth shift is very high compared to the median value with species moving deeper.
- 10 - 25: The five-year water column depth shift is much higher than the median value with species moving deeper.
- 25 - 50: The five-year water column depth shift is higher than the median value with species moving deeper.
- 50: The five-year water column depth shift average equals the median value.
- 50 - 75: The five-year water column depth shift is higher than the median value with species moving towards the surface.
- 75 - 90: The five-year water column depth shift is much higher than the median value with species moving towards the surface.
- 90 - 100: The five-year water column depth shift is very high compared to the median value with species moving towards the surface.
Indicator Source Information:
This data provides important information for fisheries management including which species are caught where and at what depth. The scientists at Ocean Adapt use this data to calculate each species’ centroid as the mean latitude and depth of catch in the survey, weighted by biomass. The centroid for each species is calculated for each year after standardizing the data to ensure that the measure is consistent over time despite changes in survey techniques and total area surveyed.
Data Background and Caveats:
The regional and national marine species distributions shown here represent the average centroid of all species caught in every year of the surveys. These species represent a wide range of habitats and species types. As species distributions respond to many environmental and biological factors, combining data from multiple diverse species allows for a more complete picture of the general trends in marine species distribution. In order to more easily track and display changes in these distributions, the first year is standardized to zero. Thus, the indicator represents relative change in distribution from the first survey year.
Alaska
Gulf of Alaska
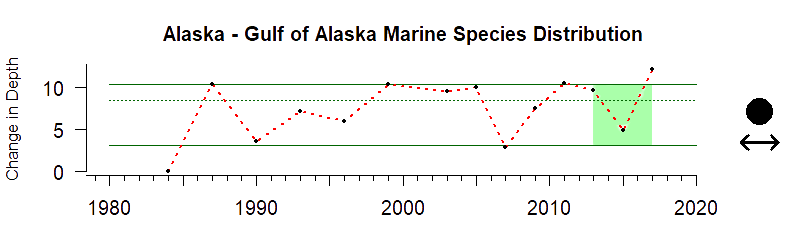
Values Indicate annual cumulative change in average species centroid depth in meters - for example, a value of -5 indicates the species centroid moving deeper by 5m.
Description of Time Series: Between 2013 and 2017 the average species water column depth shift shows no significant trend.
Description of Gauge: The gauge value of 50 indicates that between 2013 and 2017 the average species water column depth shift was the median average water column depth shift between 1984 and 2017.
Gauge Values
- 0 - 10: The five-year water column depth shift is very high compared to the median value with species moving deeper.
- 10 - 25: The five-year water column depth shift is much higher than the median value with species moving deeper.
- 25 - 50: The five-year water column depth shift is higher than the median value with species moving deeper.
- 50: The five-year water column depth shift average equals the median value.
- 50 - 75: The five-year water column depth shift is higher than the median value with species moving towards the surface.
- 75 - 90: The five-year water column depth shift is much higher than the median value with species moving towards the surface.
- 90 - 100: The five-year water column depth shift is very high compared to the median value with species moving towards the surface.
Indicator Source Information:
This data provides important information for fisheries management including which species are caught where and at what depth. The scientists at Ocean Adapt use this data to calculate each species’ centroid as the mean latitude and depth of catch in the survey, weighted by biomass. The centroid for each species is calculated for each year after standardizing the data to ensure that the measure is consistent over time despite changes in survey techniques and total area surveyed.
Data Background and Caveats:
The regional and national marine species distributions shown here represent the average centroid of all species caught in every year of the surveys. These species represent a wide range of habitats and species types. As species distributions respond to many environmental and biological factors, combining data from multiple diverse species allows for a more complete picture of the general trends in marine species distribution. In order to more easily track and display changes in these distributions, the first year is standardized to zero. Thus, the indicator represents relative change in distribution from the first survey year.
Gulf of Mexico
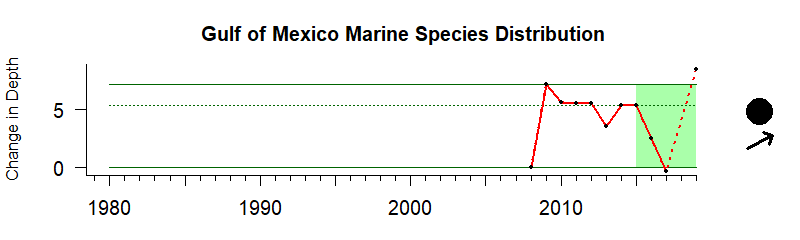
Values Indicate annual cumulative change in average species centroid depth in meters - for example, a value of -5 indicates the species centroid moving deeper by 5m.
Description of Time Series: Between 2015 and 2019 the average species water column depth shift shows an increasing trend.
Description of Gauge: The gauge value of 36 indicates that between 2015 and 2019 the average species water column depth shift was higher than the median average water column depth shift between 2008 and 2019 with species moving deeper.
Gauge Values
- 0 - 10: The five-year water column depth shift is very high compared to the median value with species moving deeper.
- 10 - 25: The five-year water column depth shift is much higher than the median value with species moving deeper.
- 25 - 50: The five-year water column depth shift is higher than the median value with species moving deeper.
- 50: The five-year water column depth shift average equals the median value.
- 50 - 75: The five-year water column depth shift is higher than the median value with species moving towards the surface.
- 75 - 90: The five-year water column depth shift is much higher than the median value with species moving towards the surface.
- 90 - 100: The five-year water column depth shift is very high compared to the median value with species moving towards the surface.
Indicator Source Information:
This data provides important information for fisheries management including which species are caught where and at what depth. The scientists at Ocean Adapt use this data to calculate each species’ centroid as the mean latitude and depth of catch in the survey, weighted by biomass. The centroid for each species is calculated for each year after standardizing the data to ensure that the measure is consistent over time despite changes in survey techniques and total area surveyed.
Data Background and Caveats:
The regional and national marine species distributions shown here represent the average centroid of all species caught in every year of the surveys. These species represent a wide range of habitats and species types. As species distributions respond to many environmental and biological factors, combining data from multiple diverse species allows for a more complete picture of the general trends in marine species distribution. In order to more easily track and display changes in these distributions, the first year is standardized to zero. Thus, the indicator represents relative change in distribution from the first survey year.
Northeast
Spring
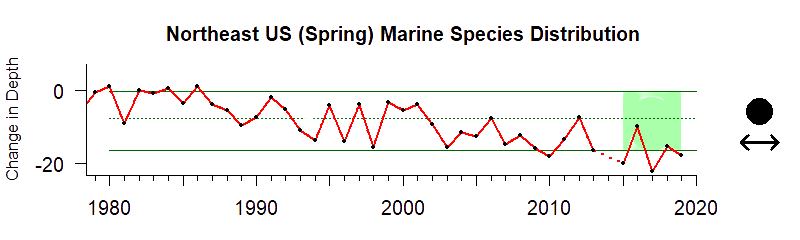
Values Indicate annual cumulative change in average species centroid depth in meters - for example, a value of -5 indicates the species centroid moving deeper by 5m.
Description of Time Series: Between 2014 and 2018 the average species water column depth shift shows no significant trend.
Description of Gauge: The gauge value of 9 indicates that between 2014 and 2018 the average species water column depth shift was very high compared to the median average water column depth shift between 1980 and 2018 with species moving deeper.
Gauge Values
- 0 - 10: The five-year water column depth shift is very high compared to the median value with species moving deeper.
- 10 - 25: The five-year water column depth shift is much higher than the median value with species moving deeper.
- 25 - 50: The five-year water column depth shift is higher than the median value with species moving deeper.
- 50: The five-year water column depth shift average equals the median value.
- 50 - 75: The five-year water column depth shift is higher than the median value with species moving towards the surface.
- 75 - 90: The five-year water column depth shift is much higher than the median value with species moving towards the surface.
- 90 - 100: The five-year water column depth shift is very high compared to the median value with species moving towards the surface.
Indicator Source Information:
This data provides important information for fisheries management including which species are caught where and at what depth. The scientists at Ocean Adapt use this data to calculate each species’ centroid as the mean latitude and depth of catch in the survey, weighted by biomass. The centroid for each species is calculated for each year after standardizing the data to ensure that the measure is consistent over time despite changes in survey techniques and total area surveyed.
Data Background and Caveats:
The regional and national marine species distributions shown here represent the average centroid of all species caught in every year of the surveys. These species represent a wide range of habitats and species types. As species distributions respond to many environmental and biological factors, combining data from multiple diverse species allows for a more complete picture of the general trends in marine species distribution. In order to more easily track and display changes in these distributions, the first year is standardized to zero. Thus, the indicator represents relative change in distribution from the first survey year.
Southeast
Spring
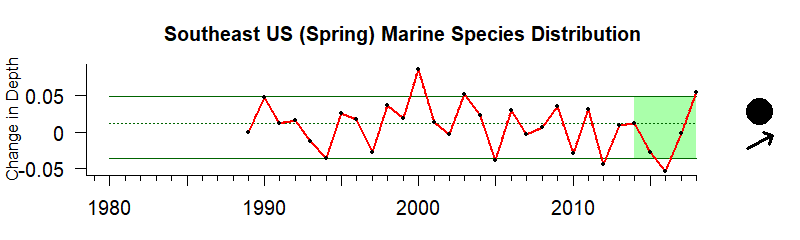
Values Indicate annual cumulative change in average species centroid depth in meters - for example, a value of -5 indicates the species centroid moving deeper by 5m.
Description of Time Series: Between 2013 and 2017 the average species water column depth shift showed an increasing trend.
Description of Gauge: The gauge value of 30 indicates that between 2013 and 2017 the average species water column depth shift was higher than the median average water column depth shift between 1989 and 2017 with species moving deeper.
Gauge Values
- 0 - 10: The five-year water column depth shift is very high compared to the median value with species moving deeper.
- 10 - 25: The five-year water column depth shift is much higher than the median value with species moving deeper.
- 25 - 50: The five-year water column depth shift is higher than the median value with species moving deeper.
- 50: The five-year water column depth shift average equals the median value.
- 50 - 75: The five-year water column depth shift is higher than the median value with species moving towards the surface.
- 75 - 90: The five-year water column depth shift is much higher than the median value with species moving towards the surface.
- 90 - 100: The five-year water column depth shift is very high compared to the median value with species moving towards the surface.
Indicator Source Information:
This data provides important information for fisheries management including which species are caught where and at what depth. The scientists at Ocean Adapt use this data to calculate each species’ centroid as the mean latitude and depth of catch in the survey, weighted by biomass. The centroid for each species is calculated for each year after standardizing the data to ensure that the measure is consistent over time despite changes in survey techniques and total area surveyed.
Data Background and Caveats:
The regional and national marine species distributions shown here represent the average centroid of all species caught in every year of the surveys. These species represent a wide range of habitats and species types. As species distributions respond to many environmental and biological factors, combining data from multiple diverse species allows for a more complete picture of the general trends in marine species distribution. In order to more easily track and display changes in these distributions, the first year is standardized to zero. Thus, the indicator represents relative change in distribution from the first survey year.
California Current
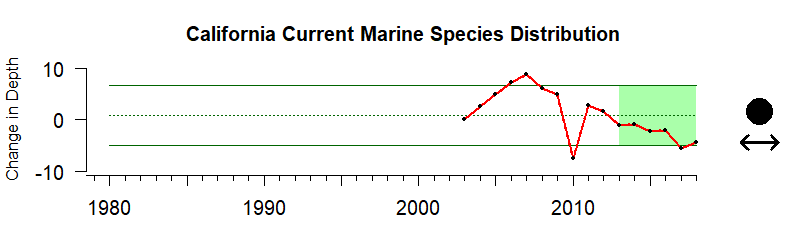
Values Indicate annual cumulative change in average species centroid depth in meters - for example, a value of -5 indicates the species centroid moving deeper by 5m.
Description of Time Series: Between 2014 and 2018 the average species water column depth shift shows no significant trend.
Description of Gauge: The gauge value of 19 indicates that between 2014 and 2018 the average species water column depth shift was much higher than the median average water column depth shift between 2003 and 2018 with species moving deeper.
Gauge Values
- 0 - 10: The five-year water column depth shift is very high compared to the median value with species moving deeper.
- 10 - 25: The five-year water column depth shift is much higher than the median value with species moving deeper.
- 25 - 50: The five-year water column depth shift is higher than the median value with species moving deeper.
- 50: The five-year water column depth shift average equals the median value.
- 50 - 75: The five-year water column depth shift is higher than the median value with species moving towards the surface.
- 75 - 90: The five-year water column depth shift is much higher than the median value with species moving towards the surface.
- 90 - 100: The five-year water column depth shift is very high compared to the median value with species moving towards the surface.
Indicator Source Information:
This data provides important information for fisheries management including which species are caught where and at what depth. The scientists at Ocean Adapt use this data to calculate each species’ centroid as the mean latitude and depth of catch in the survey, weighted by biomass. The centroid for each species is calculated for each year after standardizing the data to ensure that the measure is consistent over time despite changes in survey techniques and total area surveyed.
Data Background and Caveats:
The regional and national marine species distributions shown here represent the average centroid of all species caught in every year of the surveys. These species represent a wide range of habitats and species types. As species distributions respond to many environmental and biological factors, combining data from multiple diverse species allows for a more complete picture of the general trends in marine species distribution. In order to more easily track and display changes in these distributions, the first year is standardized to zero. Thus, the indicator represents relative change in distribution from the first survey year.
Resources
Ocean ADAPT
OceanAdapt is a collaboration between Rutgers University, the National Marine Fisheries Service (NMFS), and Fisheries and Oceans Canada (DFO) to provide information about the impacts of changing climate and other factors on the distribution of marine life to the National Climate Assessment, fisheries communities, policymakers, and to others. This website hosts an annually updated database of scientific surveys in the United States and Canada, providing tools for exploring changes in marine fish and invertebrate distributions.