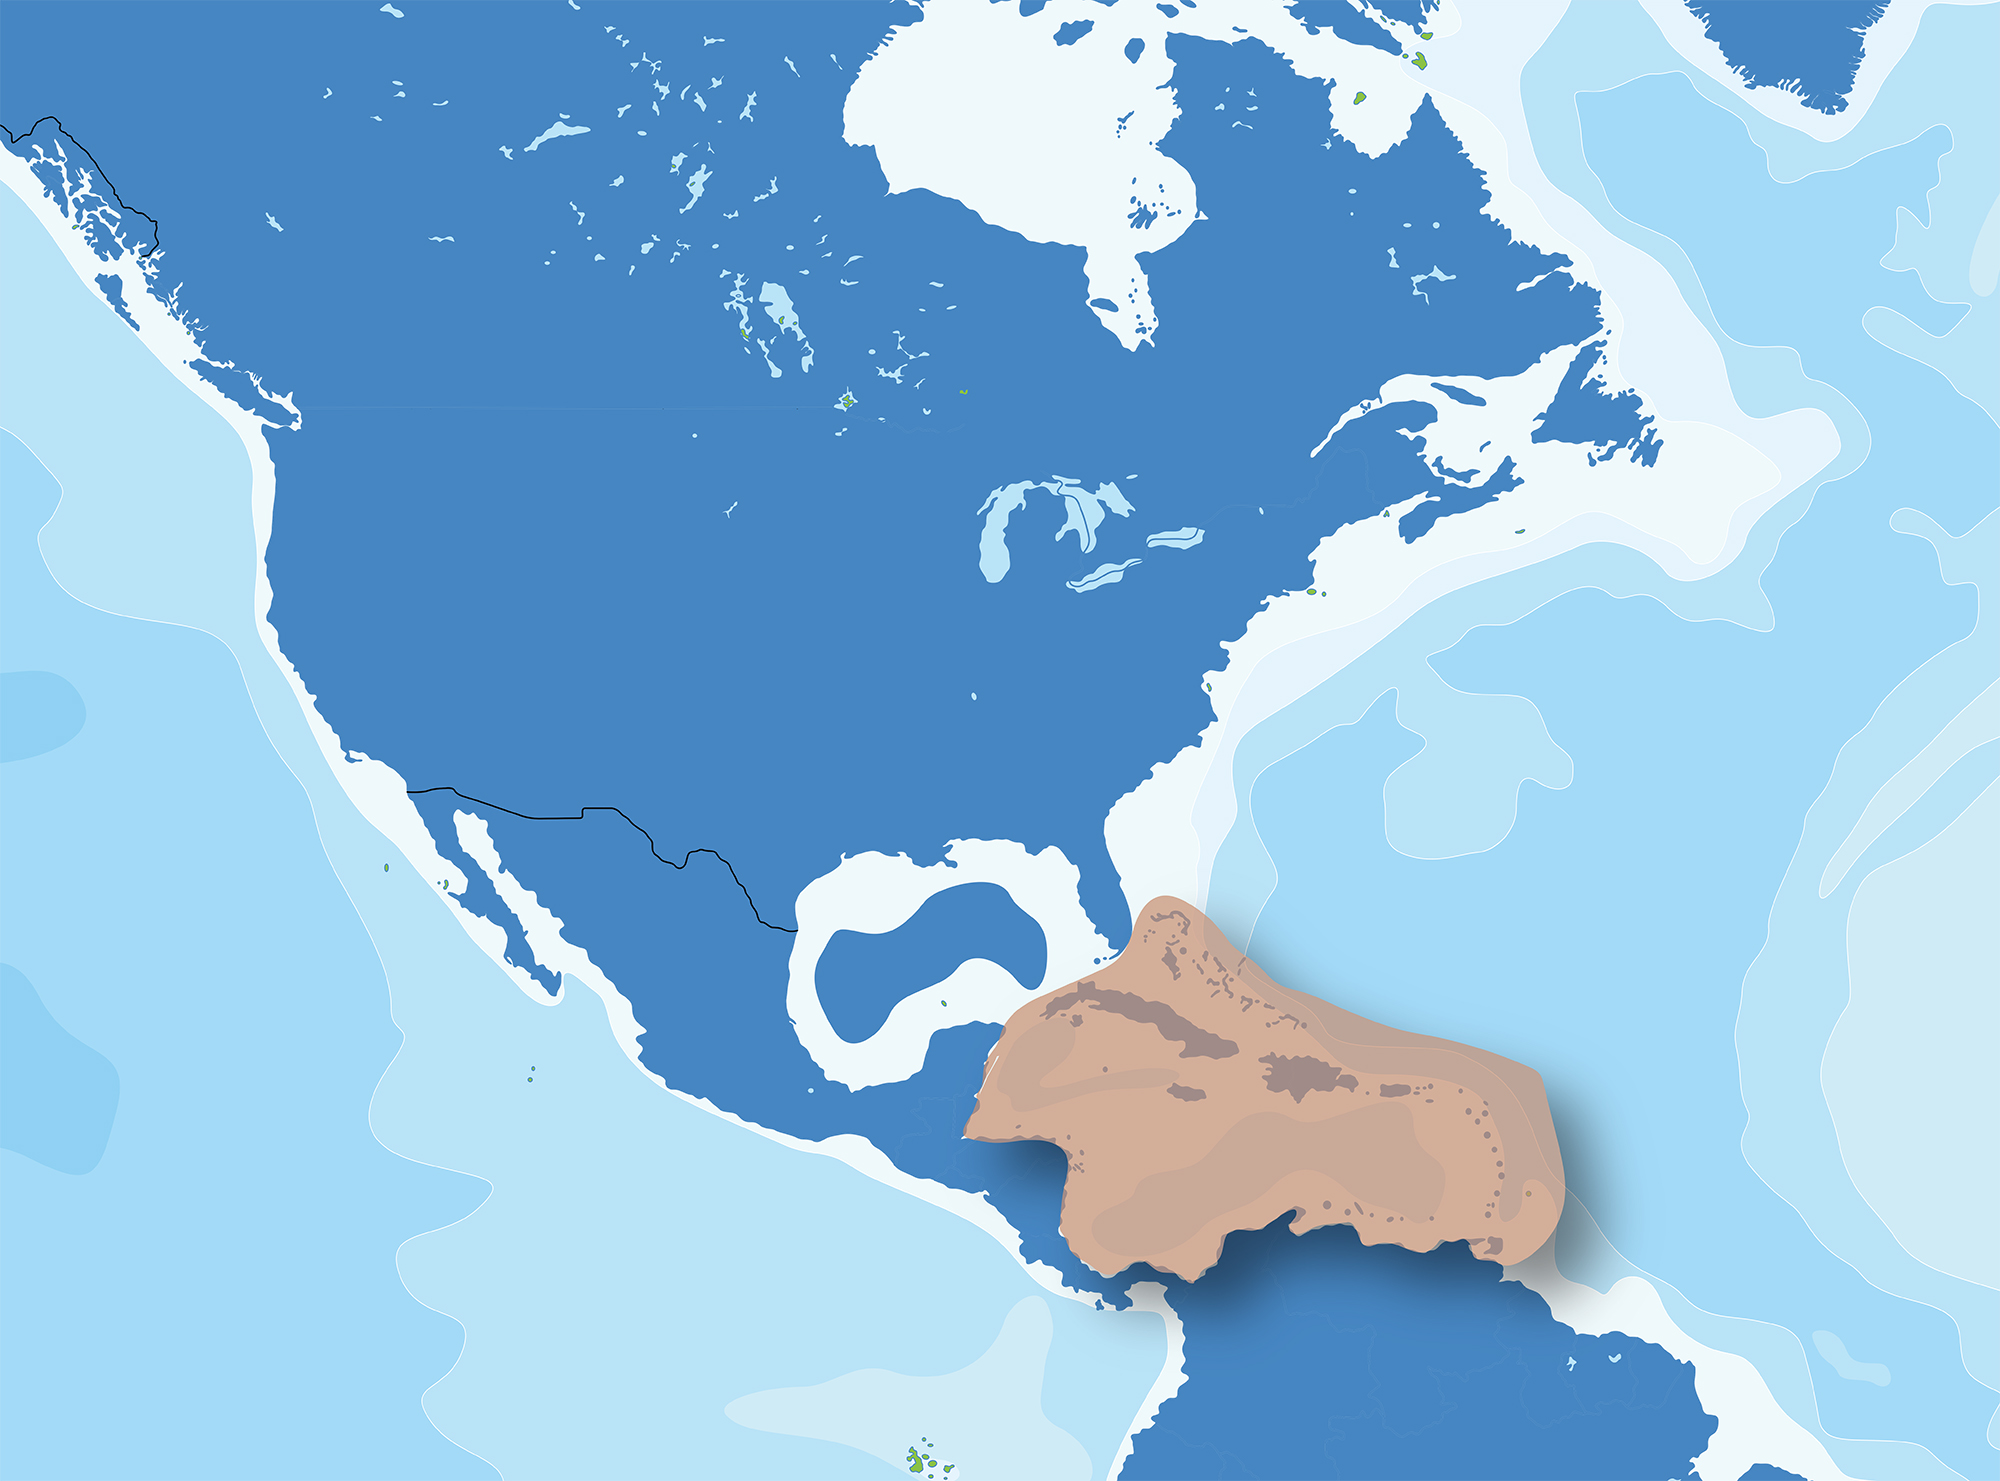
The Caribbean region is renowned for its diverse marine life, rich mixing of cultures, turquoise waters and spectacular beaches. The U.S. portions of this region (Puerto Rico and the U.S. Virgin Island) is home to some important coral reef ecosystems. As one of the most biologically rich marine environments in the Atlantic, the Caribbean is home to 10% of the world's coral reefs, 1,400 species of fish and marine mammals, and extensive coastal mangroves. The clean beaches, vibrant coral reef systems, exotic marine life, and abundant seafood support tourism and a source of food for people in the region.
Understanding the Time series plots
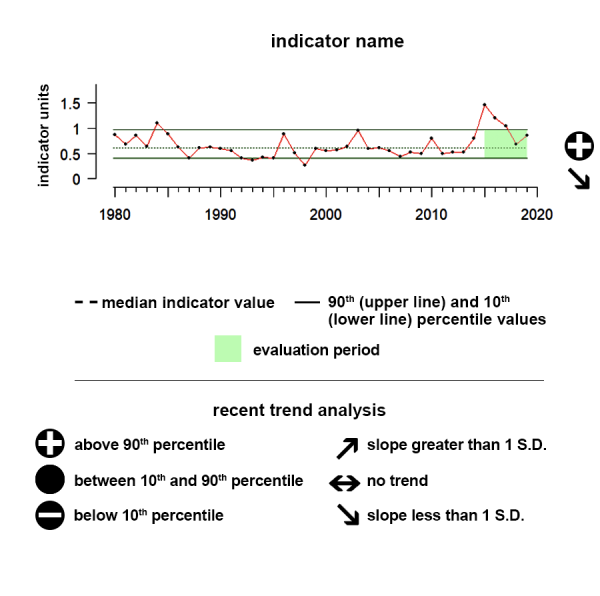
Time series plots show the changes in each indicator as a function of time, over the period 1980-present. Each plot also shows horizontal lines that indicate the median (middle) value of that indicator, as well as the 10th and 90th percentiles, each calculated for the entire period of measurement. Time series plots were only developed for datasets with at least 10 years of data. Two symbols located to the right of each plot describe how recent values of an indicator compare against the overall series. A black circle indicates whether the indicator values over the last five years are on average above the series 90th percentile (plus sign), below the 10th percentile (minus sign), or between those two values (solid circle). Beneath that an arrow reflects the trend of the indicator over the last five years; an increase or decrease greater than one standard deviation is reflected in upward or downward arrows respectively, while a change of less than one standard deviation is recorded by a left-right arrow.
North Atlantic Oscillation (NAO)
Values correspond to Index scores
Description of time series:
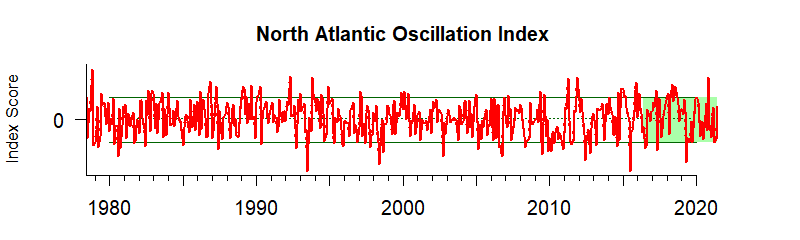
Positive NAO values mean significantly warmer winters over the upper Midwest and New England and negative NAO values can mean cold winter outbreaks and heavy snowstorms. During the last five years, the NAO indicator shows no significant trend but has remained largely in the negative phase.
Description of gauge:
The unitless two-way gauge depicts whether the average of the last 5 years of data for the climate indicator is above or below the median value of the entire time series. High values in either direction mean extreme variation from the median value of the entire time series.
Description of North Atlantic Oscillation (NAO):
The North Atlantic Oscillation (NAO) Index measures the relative strengths and positions of a permanent low-pressure system over Iceland (the Icelandic Low) and a permanent high-pressure system over the Azores (the Azores High). When the index is positive (NAO+) significantly warmer winters can occur over the upper Midwest and New England. On the East Coast of the United States a NAO+ can also cause increased rainfall, and thus warmer, less saline surface water. This prevents nutrient-rich upwelling, which reduces productivity. When the NAO index is negative, the upper central and northeastern portions of the United States can incur winter cold outbreaks and heavy snowstorms. This climate condition impacts people and ecosystems across the globe and each of the indicators presented here. Interactions between the ocean and atmosphere alter weather around the world and can result in severe storms or mild weather, drought, or flooding. Beyond “just” influencing the weather and ocean conditions, these changes can produce secondary results that influence food supplies and prices, forest fires and flooding, and create additional economic and political consequences.
Data Background:
Climate indicator data was accessed from the NOAA NCEI (https://www.ncdc.noaa.gov/teleconnections/nao/data.csv). The data plotted are unitless anomalies and averaged across a given region
Atlantic Multidecadal Oscillation (AMO)
Values correspond to Index scores
Description of time series:
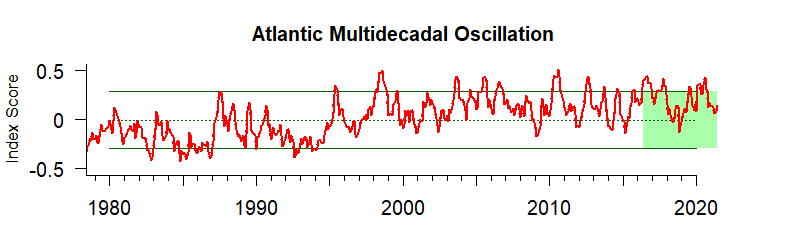
Positive AMO values indicate the warm phase, during which surface waters in the North Atlantic Ocean are warmer than average, and negative AMO values indicate the cold phase, during which surface waters in the North Atlantic Ocean are cooler than average. During the last five years, the AMO indicator shows no significant trend.
Description of gauge:
The unitless two-way gauge depicts whether the average of the last 5 years of data for the climate indicator is above or below the median value of the entire time series. High values in either direction mean extreme variation from the median value of the entire time series.
Description of Atlantic Multidecadal Oscillation (AMO):
The Atlantic Multidecadal Oscillation is a series of long-duration changes in the North Atlantic sea surface temperature, with cool and warm phases that may last for 20-40 years. Most of the Atlantic between the equator and Greenland changes in unison. Some areas of the North Pacific also seem to be affected. This broadscale climate condition affects air temperatures and rainfall over much of the Northern Hemisphere. It is also related to major droughts in the Midwest and the Southwest of the U.S. In the warm phase, these droughts tend to be more frequent and/or severe. Vice-versa for the cold phase. During the warm phases the number of tropical storms that mature into severe hurricanes is much greater than during cool phases. Despite the association of AMO with multiple weather and climate impacts, recent scientific debate has questioned whether this indicator is a natural climate variation, like the other climate indicators presented here, or a response of the climate system to human-caused climate change. Whether natural or a result of human-caused climate change, AMO is a useful feature for tracking large-scale weather and climate events. This climate condition impacts people and ecosystems across the globe and each of the indicators presented here. Interactions between the ocean and atmosphere alter weather around the world and can result in severe storms or mild weather, drought, or flooding. Beyond “just” influencing the weather and ocean conditions, these changes can produce secondary results that influence food supplies and prices, forest fires and flooding, and create additional economic and political consequences.
Data Background:
Climate indicator data was accessed from NOAA’s Earth Systems Research Laboratory (https://www.esrl.noaa.gov/psd/data/timeseries/AMO/). The data plotted are unitless anomalies and averaged across a given region
Sea Surface Temperature
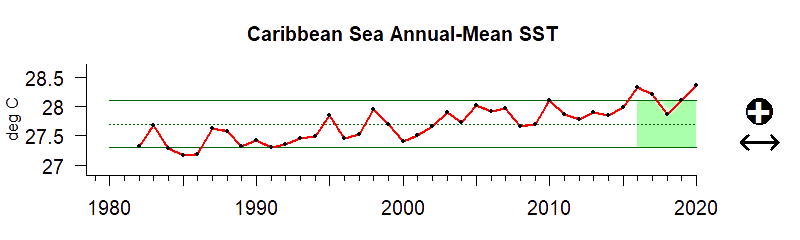
Sea surface temperature is defined as the average temperature of the top few millimeters of the ocean. Sea surface temperature monitoring tells us how the ocean and atmosphere interact, as well as providing fundamental data on the global climate system
Description of time series:
The time series shows the integrated sea surface temperature for the Caribbean region. During the last five years there has been no notable trend but values were above the 90th percentile of all observed data in the time series.
Description of gauge:
The gauge value of 92 indicates that the mean sea surface temperature between 2016 and 2020 for the Caribbean region was higher than 92% of the temperatures between 1982 and 2020.
Description of Sea Surface Temperature:
Sea surface temperature (SST) is defined as the temperature of the top few millimeters of the ocean. This temperature directly or indirectly impacts the rate of all physical, chemical, and most biological processes occurring in the ocean. SST is globally monitored by sensors on satellites, buoys, ships, ocean reference stations, autonomous underwater vehicles (AUVs) and other technologies.
SST monitoring tells us how the ocean and atmosphere interact, as well as providing fundamental data on the global climate system. This information also aids us in weather prediction, i.e. identifying the onset of El Niño and La Niña cycles - multiyear shifts in atmospheric pressure and wind speeds. These shifts affect ocean circulation, global weather patterns, and marine ecosystems. SST anomalies have been linked to shifting marine resources. With warming temperatures, we observe the poleward movements of fish and other species. Temperature extremes—both ocean heatwaves and cold spells—have been linked to coral bleaching as well as fishery and aquaculture mortality. We present the annual average SST at the Large Marine Ecosystem scale in all regions.
Indicator and source information:
The SST data were accessed from (https://www.ncdc.noaa.gov/oisst). The data are plotted in degrees Celsius.
Data background and limitations:
To compensate for platform differences and sensor biases, satellite and ship observations are referenced to buoys. These data are NOAA 1/4° Daily Optimum Interpolation Sea Surface Temperature (version 2.1). Measurements of SST served through this portal incorporate data obtained from various platforms such as satellites, buoys, Argo floats, and ships.
Sea Level
Coastal Sea Level from Tide Gauges
Description of time series:
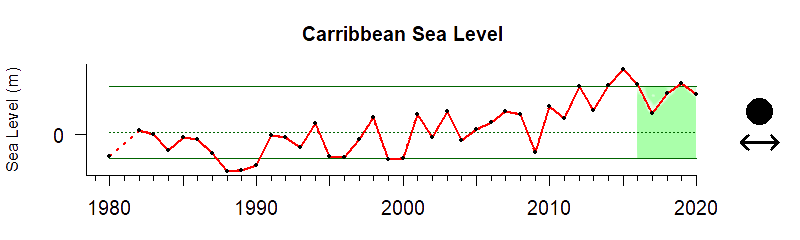
The time series shows the relative sea level, water height as compared to nearby land level, for the Caribbean region. During the last five years there has been no notable trend and values have remained within the 10th and 90th percentiles of all observed data in the time series.
Description of gauge:
The gauge value of 85 indicates that the sea level between 2016 and 2020 for the Caribbean region was higher than 85% of the sea level between 1980 and 2020.
Description of Sea Level:
Sea level varies due to the force of gravity, the Earth’s rotation and irregular features on the ocean floor. Other forces affecting sea levels include temperature, wind, ocean currents, tides, and other similar processes. With 40 percent of Americans living in densely populated coastal areas, having a clear understanding of sea level trends is critical to societal and economic well being.
Measuring and predicting sea levels, tides and storm surge are important for determining coastal boundaries, ensuring safe shipping, emergency preparedness, and other aspects of the well-being of coastal communities.
Indicator and source information:
NOAA monitors sea levels using tide stations and satellite laser altimeters. Tide stations around the globe tell us what is happening at local levels, while satellite measurements provide us with the average height of the entire ocean. Taken together, data from these sources are fed into models that tell us how our ocean sea levels are changing over time. For this site, data from tide stations around the US were combined to create regionally averaged records of sea-level change since 1980. We present data for all regions.
Data background and limitations:
Sea level data presented here are measurements of relative sea level, water height as compared to nearby land level, from NOAA tide gauges that have >20 years of hourly data served through NOAA’s Center for Operational Oceanographic Products and Services (CO-OPS) Tides and Currents website. These local measurements are regionally averaged by taking the median value of all the qualifying stations within a region. The measurements are in meters and are relative to the year 2000.
Chlorophyll-a
Chlorophyll a, a pigment produced by phytoplankton, can be measured to determine the amount of phytoplankton present in water bodies. From a human perspective, high values of chlorophyll a can be good (abundance of nutritious diatoms as food for fish) or bad (Harmful Algal Blooms that may cause respiratory distress for people), based on the associated phytoplankton species.
Description of time series:
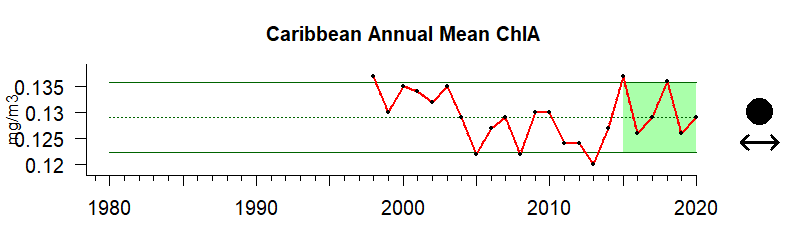
This time series shows the average concentration levels of chlorophyll ɑ for the Caribbean region. During the last five years there has been no notable trend and values have remained within the 10th and 90th percentiles of all observed data in the time series.
Description of gauge:
The gauge value of 57 indicates that between 2016 and 2020 the average concentration levels of chlorophyll a in the Caribbean region were slightly higher than the long term median of all chlorophyll ɑ concentration levels between 1998 and 2020.
Gauge values
0–10: Chlorophyll a was significantly lower than the long term median state.
10–25: Chlorophyll a was considerably lower than the long term median state.
25–50: Chlorophyll a was slightly lower than the long term median state.
50: Chlorophyll a was at the long term median state.
50–75: Chlorophyll a was slightly higher than the long term median state.
75–90: Chlorophyll a was considerably higher than the long term median state.
90–100: Chlorophyll a was significantly higher than the long term median state.
Description of Chlorophyll a:
Phytoplankton are microscopic plants at the base of most marine food webs and produce nearly half of the Earth’s oxygen. One way we estimate the number of phytoplankton in the ocean is by measuring the amount of chlorophyll a in the water. Chlorophyll a is a green pigment (the same pigment that makes tree leaves appear green) that the phytoplankton use to absorb sunlight. The amount (or concentration) of chlorophyll a in surface waters can be calculated by measuring the color of the water ( also referred to as “ocean color”) which can be “seen” by sensors on satellites in space almost like your eyes see the color of the ocean. Environmental and oceanographic factors continuously influence the abundance, species composition, spatial distribution, and productivity of phytoplankton. Tracking the amount of phytoplankton in the ocean conveys the status of the base of the food web, and how much food is available for other animals. Changes in the amount of phytoplankton in the ocean are part of the natural seasonal cycle (similar to seasonal changes of plants on land), but can also indicate an ecosystem’s response to a major external disturbance such as a hurricane or typhoon.
Indicator and source information:
The data for this Chlorophyll a annual indicator were provided by the NOAA Fisheries Coastal and Oceanic Plankton Ecology, Production, and Observations Database (COPEPOD). COPEPOD determined the annual Large Marine Ecosystem (LME) chlorophyll a concentrations using mapped, monthly composites of chlorophyll a concentration as calculated from radiance measurements ("ocean color") made by the SeaWiFS and MODIS-Aqua satellite sensors. These monthly composites were obtained from NASA (https://oceancolor.gsfc.nasa.gov/). Annual means for each LME for each year were calculated from the average of the LME 12 monthly means in that year. The overall “National Annual Mean mean was calculated as the average of all LME annual means. See the Data Background section for more details. Source: https://www.st.nmfs.noaa.gov/copepod/about/about-copepod.html.
To learn more about satellite-based chlorophyll a measurements within NOAA or to supplement the time series data shown here, please visit NOAA CoastWatch for more information and assistance.
Data background and limitations:
Satellite chlorophyll a, 9 km mapped, monthly composited data from SeaWiFS and MODIS-Aqua NASA products were spatially re-binned into 0.5 degree latitude by 0.5 degree longitude boxes (nominally about 50 km2 near the equator) then those ~50 km2 box values were averaged over the area of a given LME, resulting in 12 values per LME, one value for each month. The annual LME chlorophyll a amount reported here is the average of those 12 monthly values. This technique was done for each LME from North America and Hawaii. The overall “National Annual Mean mean was calculated as the average of all the LME annual means. Note that chlorophyll a is often plotted on a logarithmic scale to accentuate proportional changes. In other words, small changes in concentration when amounts are relatively low could mean a very big proportional change in the phytoplankton whereas the same change in absolute concentration when concentrations are relatively large is less meaningful.
Coral Reefs
Puerto Rico
Data Interpretation:
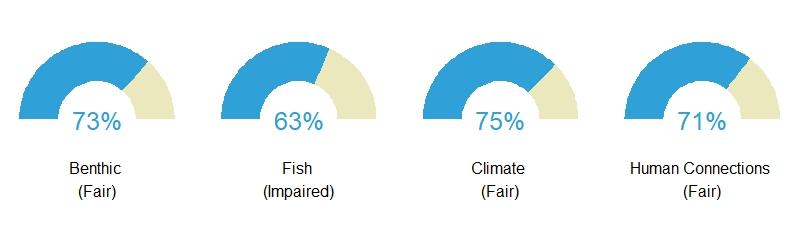
The scores you see for each region are composite scores for the themes and then one overall score. The overall score is an average of all four theme scores for the Puerto Rico region’s coral reef ecosystem score.
Benthic – Composite gauge for benthic theme score in the Puerto Rico region is 73%, meaning it is ranked fair with some indicators meeting reference values.
Fish – Composite gauge for fish theme score in the Puerto Rico region is 63%, meaning it is ranked impaired with very few indicators meeting reference values.
Climate – Composite gauge for climate theme score in the Puerto Rico region is 75%, meaning it is ranked fair with some indicators meeting reference values.
Human connections – Composite gauge for human connections theme score in the Puerto Rico region is 71%, meaning it is ranked fair with some indicators meeting reference values.
Overall Ecosystem – Overall coral reef ecosystem score for the Puerto Rico region is 70%, meaning it is ranked fair with some indicators meeting reference values.
Description of each theme is provided in the indicator information section below.
Gauge values
90–100% Very good: All or almost all indicators meet reference values.
80–89% Good: Most indicators meet reference values.
70–79% Fair: Some indicators meet reference values.
60–69% Impaired: Few indicators meet reference values.
0–59% Critical: Very few or no indicators meet reference values.
Description of Puerto Rico coral reefs
Puerto Rico is a volcanic island in the Greater Antilles located in the north central Caribbean between the US Virgin Islands to the east and the island of Hispaniola to the west. In addition to the main island, the islands of Mona, Monito, Desecheo, Caja de Muertos, Vieques, and Culebra make up the Commonwealth of Puerto Rico. Puerto Rico was not divided into sub-regions. The total coral reef hardbottom habitat less than 30 m in depth that was monitored is 994.5 sq km.
Description of Coral Reefs:
Coral reefs are some of the most diverse and valuable ecosystems on Earth. Though they cover less than one percent of the Earth’s surface, they are estimated to provide ecosystem services (economic and environmental services) worth hundreds of billions of dollars each year. Healthy reefs protect islands and coasts from storm surge, contribute to local economies through tourism (i.e., sportfishing, snorkeling, and diving), and contribute about one-quarter of the total fish catch, providing critical food resources for tens of millions of people particularly in developing island nations.
Data Source:
The coral reef ecosystem scores shown here were analyzed using data from the National Coral Reef Monitoring Program (NCRMP). The scores you see for each region are composite scores for all four themes (benthic, fish, climate, human connections) assessed separately and then one overall score. The overall score is an average of all four theme scores for a specific region’s coral reef ecosystem score. The sources for these values and geographical regions are obtained from the NCRMP’s Status Report Scoring Methodology for Pacific Jurisdictions and 2020 Status Report Scoring Methodology for Atlantic Jurisdictions. The definitions for the themes are as follows:
- Benthic (Corals & algae): Corals and algae make up the base of the coral reef ecosystem, providing food and shelter for fish and other marine animals.
- Fish: Coral reefs serve a vital ecological role for fish species. Fish are important to the ecology of the reef, the economy, and the livelihoods of local communities.
- Climate: Climate affects all components of a reef system. Climate change and ocean acidification influence reefs across the globe, but conditions vary at the regional and local level.
- Human Connections: Coral reef management agencies protect reef resources through management plans, public education, and involving communities in managing their resources.
Coral Reefs
US Virgin Islands
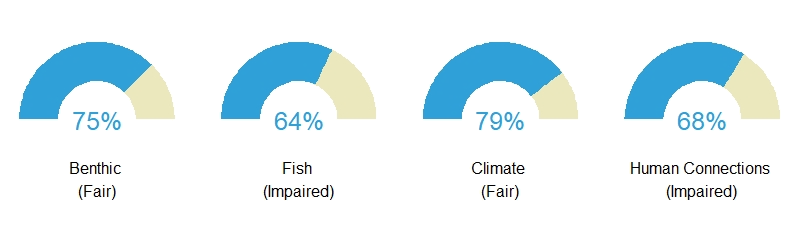
Data Interpretation:
The scores you see for each region are composite scores for the themes and then one overall score. The overall score is an average of all four theme scores for the US Virgin Islands region’s coral reef ecosystem score.
Benthic – Composite gauge for benthic theme score in the US Virgin Islands region is 75%, meaning it is ranked fair with some indicators meeting reference values.
Fish – Composite gauge for fish theme score in the US Virgin Islands region is 64%, meaning it is ranked impaired with very few indicators meeting reference values.
Climate – Composite gauge for climate theme score in the US Virgin Islands region is 79%, meaning it is ranked fair with some indicators meeting reference values.
Human connections – Composite gauge for human connections theme score in the US Virgin Islands region is 68%, meaning it is ranked impaired with very few indicators meeting reference values.
Overall Ecosystem – Overall coral reef ecosystem score for the US Virgin Islands region is 72%, meaning it is ranked fair with some indicators meeting reference values.
Description of each theme is provided in the indicator information section below.
Gauge values
90–100% Very good: All or almost all indicators meet reference values.
80–89% Good: Most indicators meet reference values.
70–79% Fair: Some indicators meet reference values.
60–69% Impaired: Few indicators meet reference values.
0–59% Critical: Very few or no indicators meet reference values.
Description of US Virgin Islands
The US Virgin Islands are an unincorporated territory located southeast of Florida between the Atlantic Ocean and Caribbean Sea. The territory consists of three major islands and many smaller islands, all surrounded by fringing coral reefs. The US Virgin Islands were divided into two subregions to evaluate condition. The two regions are St. Thomas/St. John and St. Croix. The total coral reef hardbottom habitat less than 30 m in depth that was monitored is 358 sq km.
Description of Coral Reefs:
Coral reefs are some of the most diverse and valuable ecosystems on Earth. Though they cover less than one percent of the Earth’s surface, they are estimated to provide ecosystem services (economic and environmental services) worth hundreds of billions of dollars each year. Healthy reefs protect islands and coasts from storm surge, contribute to local economies through tourism (i.e., sportfishing, snorkeling, and diving), and contribute about one-quarter of the total fish catch, providing critical food resources for tens of millions of people particularly in developing island nations.
Data Source:
The coral reef ecosystem scores shown here were analyzed using data from the National Coral Reef Monitoring Program (NCRMP). The scores you see for each region are composite scores for all four themes (benthic, fish, climate, human connections) assessed separately and then one overall score. The overall score is an average of all four theme scores for a specific region’s coral reef ecosystem score. The sources for these values and geographical regions are obtained from the NCRMP’s Status Report Scoring Methodology for Pacific Jurisdictions and 2020 Status Report Scoring Methodology for Atlantic Jurisdictions. The definitions for the themes are as follows:
- Benthic (Corals & algae): Corals and algae make up the base of the coral reef ecosystem, providing food and shelter for fish and other marine animals.
- Fish: Coral reefs serve a vital ecological role for fish species. Fish are important to the ecology of the reef, the economy, and the livelihoods of local communities.
- Climate: Climate affects all components of a reef system. Climate change and ocean acidification influence reefs across the globe, but conditions vary at the regional and local level.
- Human Connections: Coral reef management agencies protect reef resources through management plans, public education, and involving communities in managing their resources.
Overfished Stocks
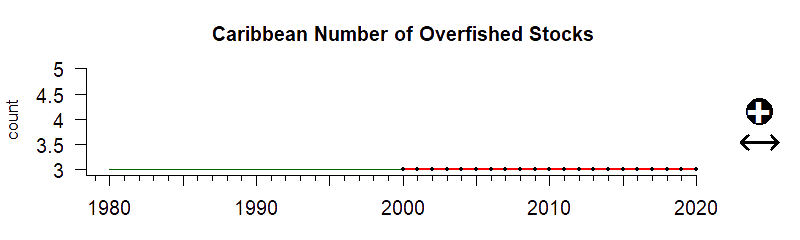
The x-axis represents years. The y-axis represents the number of fish stocks or fish populations that are deemed by NOAA as overfished. Overfished means the population of fish is too low. Therefore the population can not support a large amount of fishing.
Description of time series:
The series shows the number of fish populations that have qualified as overfished since 2000. Between 2016 and 2020 the number of overfished stocks shows no trend.
Description of gauge:
Gauge analysis was not appropriate for these data.
Overall Scores mean the following:
High values for overfished stocks are bad, low numbers are good.
- 0 - 10: The five-year overfished stock status average is very low compared to the median value.
- 10 - 25: The five-year overfished stock status average is much lower than the median value.
- 25 - 50: The five-year overfished stock status average is lower than the median value.
- 50: The five-year overfished stock status average equals the median value.
- 50 - 75: The five-year overfished stock status average is higher than the median value.
- 75 - 90: The five-year overfished stock status average is much higher than the median value.
- 90 - 100: The five-year overfished stock status average is very high compared to the median value.
Description of Overfished Stocks:
An overfished stock is a population of fish that is too low. From a technical standpoint, a stock that is overfished is depleted below a minimum level and active rebuilding is required. Stocks that are overfished cannot support a large amount of fishing. A fish stock can be listed as overfished as the result of many factors including overfishing, habitat degradation, pollution, climate change, and disease. The Magnuson-Stevens Act requires the status of overfished stocks be reported annually.
Stock assessments provide information to determine if a stock is overfished or experiencing overfishing (harvest higher than a maximum fishing threshold). This is done by estimating fishing intensity and the abundance of fish stocks and comparing those estimates to management reference points. Stock assessments can provide the science that supports the steps necessary to rebuild overfished stocks to sustainable levels.
It is important to track the status of fish stocks because fish play an important role in marine ecosystems, such as supporting the ecological structure of many marine food webs. Fish also support significant parts of coastal economies including recreational and commercial fisheries, and play an important cultural role in many regions.
This site presents the number of overfished stocks by year in all US Large Marine Ecosystems (LMEs)
Data Source:
Data were obtained from the NOAA Fisheries Fishery Stock Status website. Stocks that met the criteria for overfished status were summed by year for each region.
Coastal Employment
Values correspond to total employment in all industries in a given region
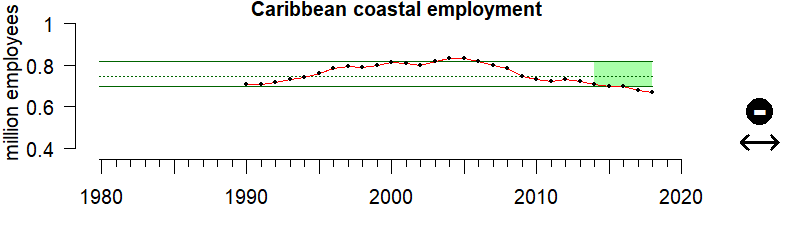
Description of time series:
Average coastal employment within the U.S. Caribbean between 2014 and 2018 was substantially below historical levels, with a decreasing trend over that period.
Description of gauge:
The gauge value of 6 indicates that coastal employment between 2014 and 2018 for the US Caribbean was higher than only 6% of all years between 1990 and 2018.
Extreme Gauge values:
A value of zero on the gauge means that the average coastal employment level over the last 5 years of data was below any annual employment level up until that point, while a value of 100 would indicate the average over that same period was above any annual employment level up until that point.
Description of coastal employment:
The total coastal employment is the number of jobs in coastal communities. Businesses in coastal counties employ tens of millions of people nationally. This includes hundreds of thousands of ocean-dependent businesses that pay over $100 billion in wages annually. Many coastal and ocean amenities attracting visitors are free, generating no direct employment, wages, or gross domestic product. However, these “nonmarket” features are key drivers for many coastal businesses. We present data for all regions.
Data Source:
Coastal employment numbers were downloaded from the U.S. Bureau of Labor Statistics’ quarterly census of employment and wages, filtered to present only coastal county values using the Census Bureau’s list of coastal counties within each state. Of note is that these data fail to include self-employed individuals. Coastal county employment numbers were then summed within each region for reporting purposes.
Billion-Dollar Disasters
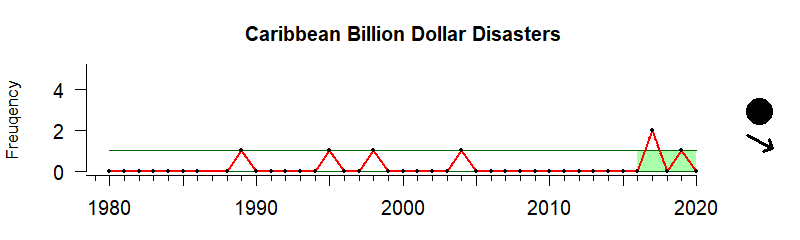
Values correspond to the number of events in a given year
Interpretation of Time Series
Billion dollar disasters in the Caribbean in the last 5 years indicates that there is no significant trend in the number of storms from historical patterns of events.
Interpretation of Gauge
The gauge value of 85 indicates that the number of billion dollar disasters between 2016 and 2020 for the Caribbean was higher than 85% of all years between 1980 and 2020.
Extreme Gauge values
A value of zero on the gauge means that the average number of disasters over the last 5 years of data was below any annual level up until that point, while a value of 100 would indicate the average over that same period was above any annual number of disasters up until that point.
Description of billion dollar disasters:
In the United States, the number of weather and climate-related disasters exceeding 1 billion dollars has been increasing since 1980. These events have significant impacts to coastal economies and communities. The Billion Dollar Disaster indicator provides information on the frequency and the total estimated costs of major weather and climate events that occur in the United States. This indicator compiles the annual number of weather and climate-related disasters across seven event types. We Present the total annual number of disaster events for all regions.
Indicator Source Information:
Billion dollar disaster event frequency data are taken from NOAA’s National Centers for Environmental Information. The number of disasters within each region were summed for every year of available data. Although the number is the count of unique disaster events within a region, the same disaster can impact multiple regions, meaning a sum across regions will overestimate the unique number of disasters.
Data Background and Caveats:
Events are included if they are estimated to cause more than one billion U.S. dollars in direct losses. The cost estimates of these events are adjusted for inflation using the Consumer Price Index (CPI) and are based on costs documented in several Federal and private-sector databases.
Source and analysis of data:
Billion dollar disaster event frequency data are taken from NOAA’s National Centers for Environmental Information. The number of disasters within each region were summed for every year of available data. Although the number is the count of unique disaster events within a region, the same disaster can impact multiple regions, meaning a sum across regions will overestimate the unique number of disasters.

Resources
Florida Keys National Marine Sanctuary Condition Report
This "condition report" provides a summary of resources in the National Oceanic and Atmospheric Administration's Florida Keys National Marine Sanctuary (sanctuary), pressures on those resources, current conditions and trends, and management responses to the pressures that threaten the integrity of the marine environment.

Florida Keys National Marine Sanctuary Ecosystem Status Report
This Ecosystem Status Report is compiled by NOAA’s Florida Keys Integrated Ecosystem Assessment Program (IEA) team, in collaboration with academic partners, Sanctuary resource managers and scientists, non governmental organizations, and other government and state agencies.
Gray's Reef National Marine Sanctuary Condition Report
This “condition report” provides a summary of resources in the National Oceanic and Atmospheric Administration’s Gray’s Reef National Marine Sanctuary, pressures on those resources, current condition and trends, and management responses to the pressures that threaten the integrity of the marine environment.

Caribbean Regional Association for Coastal Ocean Observing (CariCOOS)
The Caribbean Regional Association for Coastal Ocean Observing (CARICOOS) is the regional association for the coastal and ocean observing system that is being developed for Puerto Rico and the U.S. Virgin Islands.
MBON and the Sanctuaries MBON project
The Marine Biodiversity Observation Network (MBON) is a growing global initiative composed of regional networks of scientists, resource managers, and end-users working to integrate data from existing long-term programs to improve our understanding of changes and connections between marine biodiversity and ecosystem functions.

NOAA Environmental Response Management Application (ERMA): Regional Portals
The Environmental Response Management Application is a web-based Geographic Information System (GIS) tool that assists emergency responders and environmental resource managers in dealing with incidents that may adversely impact the environment.
NOAA Coral Reef Conservation Program
The National Oceanic and Atmospheric Administration (NOAA) Coral Reef Conservation Program is investing approximately $4.5 million of its annual operating budget to support a National Coral Reef Monitoring Plan (NCRMP) for biological, physical, and socioeconomic monitoring throughout the U.S. Pacific, Atlantic, and Caribbean coral reef areas.
Puerto Rico Long-Term Coral Reef Monitoring Program Database Compilation
The Puerto Rico Long-Term Coral Reef Monitoring Program (PRCRMP) database compilation includes raw biological data (by transect) from reef locations around the Puerto Rican archipelago. Substrate cover by sessile-benthic categories and fish, and motile megabenthic invertebrate taxonomic composition and densities have been characterized in these stations, with variable sampling event frequencies between 1999 to 2019.
