Description of Marine Mammal Strategic and Depleted Stocks (MMPA):
A stock is defined by the Marine Mammal Protection Act (MMPA), as a group of marine mammals of the same species or smaller taxa in a common spatial arrangement, that interbreed when mature. See a list of the marine mammal stocks NOAA protects under the MMPA.
A strategic stock is defined by the MMPA as a marine mammal stock—
- For which the level of direct human-caused mortality exceeds the potential biological removal level or PBR (defined by the MMPA as the maximum number of animals, not including natural mortalities, that may be removed from a marine mammal stock while allowing that stock to reach or maintain its optimum sustainable population);
- Which, based on the best available scientific information, is declining and is likely to be listed as a threatened species under the Endangered Species Act (ESA) within the foreseeable future; or
- Which is listed as a threatened or endangered species under the ESA, or is designated as depleted under the MMPA.
A depleted stock is defined by the MMPA as any case in which—
- The Secretary of Commerce, after consultation with the Marine Mammal Commission and the Committee of Scientific Advisors on Marine Mammals established under MMPA title II, determines that a species or population stock is below its optimum sustainable population;
- A State, to which authority for the conservation and management of a species or population stock is transferred under section 109, determines that such species or stock is below its optimum sustainable population; or
- A species or population stock is listed as an endangered species or a threatened species under the ESA.
Description of Threatened and Endangered Marine Mammals (ESA):
NOAA Fisheries is responsible for the protection, conservation, and recovery of endangered and threatened marine and anadromous species under the Endangered Species Act (ESA). The ESA aims to conserve these species and the ecosystems they depend on. Under the ESA, a species is considered endangered if it is in danger of extinction throughout all or a significant portion of its range, or threatened if it is likely to become endangered in the foreseeable future throughout all or a significant portion of its range See a species directory of all the threatened and endangered marine species under NOAA Fisheries jurisdiction, including marine mammals.
Under the ESA, a species must be listed if it is threatened or endangered because of any of the following 5 factors:
1) Present or threatened destruction, modification, or curtailment of its habitat or range;
2) Over-utilization of the species for commercial, recreational, scientific, or educational purposes;
3) Disease or predation;
4) Inadequacy of existing regulatory mechanisms; and
5) Other natural or manmade factors affecting its continued existence.
The ESA requires that listing determinations be based solely on the best scientific and commercial information available; economic impacts are not considered in making species listing determinations and are prohibited under the ESA. There are two ways by which a species may come to be listed (or delisted) under the ESA:
- NOAA Fisheries receives a petition from a person or organization requesting that NOAA lists a species as threatened or endangered, reclassify a species, or delist a species.
- NOAA Fisheries voluntarily chooses to examine the status of a species by initiating a status review of a species.
Data Source:
Here, we present the annual number of strategic and depleted marine mammal stocks and the annual number of threatened and endangered marine mammals in all regions except the Caribbean. Data for the Southeast and Gulf of Mexico regions are combined. Data are summarized using NOAA’s PR-SIS Data Portal (which is not public-facing), but all information displayed can be found on the NOAA Fisheries Marine Mammal Stock Assessments Page for strategic and depleted marine mammal stocks, and on the NOAA Fisheries Threatened and Endangered Species Directory Page for threatened and endangered marine mammals.
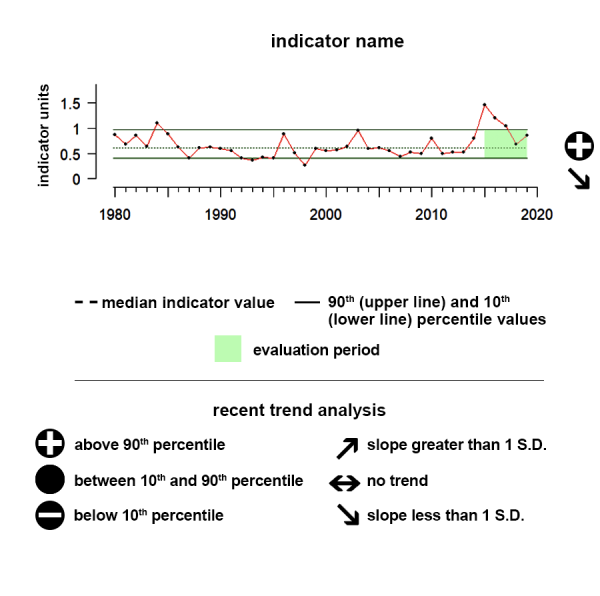
Understanding the Time series plots
Time series plots show the changes in each indicator as a function of time, over the period 1980-present. Each plot also shows horizontal lines that indicate the median (middle) value of that indicator, as well as the 10th and 90th percentiles, each calculated for the entire period of measurement. Time series plots were only developed for datasets with at least 10 years of data. Two symbols located to the right of each plot describe how recent values of an indicator compare against the overall series. A black circle indicates whether the indicator values over the last five years are on average above the series 90th percentile (plus sign), below the 10th percentile (minus sign), or between those two values (solid circle). Beneath that an arrow reflects the trend of the indicator over the last five years; an increase or decrease greater than one standard deviation is reflected in upward or downward arrows respectively, while a change of less than one standard deviation is recorded by a left-right arrow.
Marine mammal species listed as threatened or endangered under the Endangered Species Act
Alaska
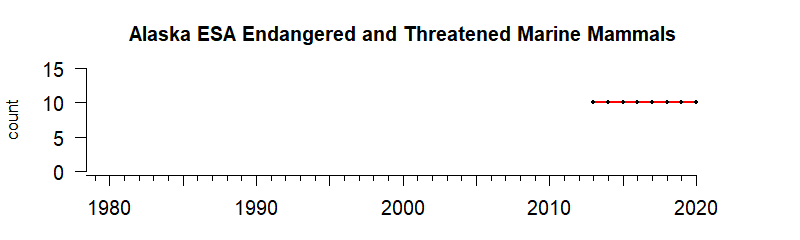
Values Correspond to the Number of ESA Threatened or Endangered Species in a given region
Data Interpretation
Gauge and Trend Analyses were not appropriate for marine mammal data.
Data Background and Caveats
NOAA Fisheries goes through required regulatory steps to list, reclassify, or delist a species under the ESA. For more information, see a step-by-step description of the ESA listing process. The listing process requires time and resources; as a result, the timing and number of listed marine species is not necessarily indicative of the actual number of currently endangered or threatened species and the exact timing of when these species became eligible to be listed under the ESA. Many marine species were initially listed when the ESA was passed in 1973; others have taken more time to be listed, and some have been reclassified or delisted since then.
Hawai'i-Pacific Islands
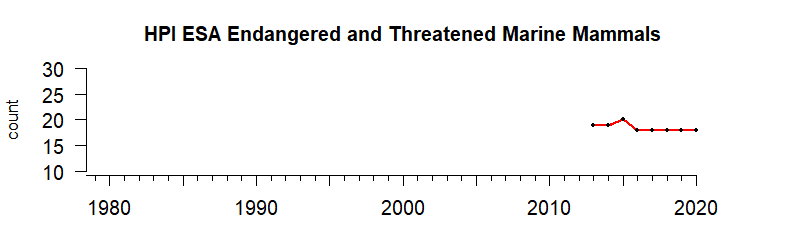
Values Correspond to the Number of ESA Threatened or Endangered Species in a given region
Data Interpretation
Gauge and Trend Analyses were not appropriate for marine mammal data.
Data Background and Caveats
NOAA Fisheries goes through required regulatory steps to list, reclassify, or delist a species under the ESA. For more information, see a step-by-step description of the ESA listing process. The listing process requires time and resources; as a result, the timing and number of listed marine species is not necessarily indicative of the actual number of currently endangered or threatened species and the exact timing of when these species became eligible to be listed under the ESA. Many marine species were initially listed when the ESA was passed in 1973; others have taken more time to be listed, and some have been reclassified or delisted since then.
California Current
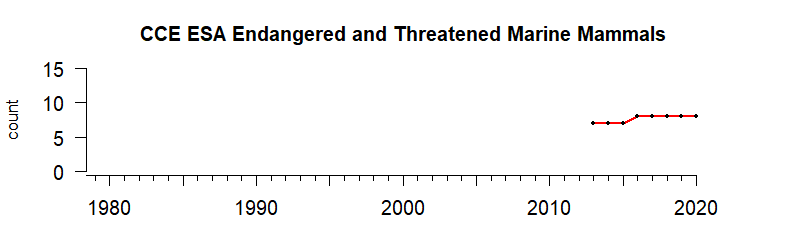
Values Correspond to the Number of ESA Threatened or Endangered Species in a given region
Data Interpretation
Gauge and Trend Analyses were not appropriate for marine mammal data.
Data Background and Caveats
NOAA Fisheries goes through required regulatory steps to list, reclassify, or delist a species under the ESA. For more information, see a step-by-step description of the ESA listing process. The listing process requires time and resources; as a result, the timing and number of listed marine species is not necessarily indicative of the actual number of currently endangered or threatened species and the exact timing of when these species became eligible to be listed under the ESA. Many marine species were initially listed when the ESA was passed in 1973; others have taken more time to be listed, and some have been reclassified or delisted since then.
Southeast and Gulf of Mexico
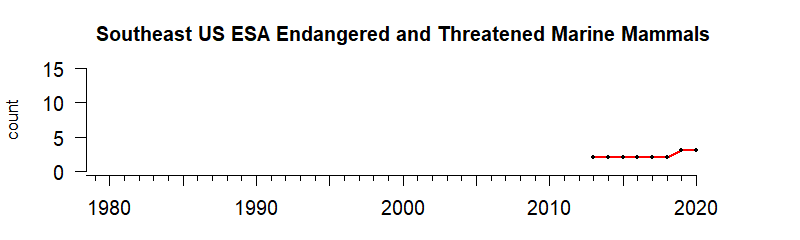
Values Correspond to the Number of ESA Threatened or Endangered Species in a given region
Data Interpretation
Gauge and Trend Analyses were not appropriate for marine mammal data.
Data Background and Caveats
NOAA Fisheries goes through required regulatory steps to list, reclassify, or delist a species under the ESA. For more information, see a step-by-step description of the ESA listing process. The listing process requires time and resources; as a result, the timing and number of listed marine species is not necessarily indicative of the actual number of currently endangered or threatened species and the exact timing of when these species became eligible to be listed under the ESA. Many marine species were initially listed when the ESA was passed in 1973; others have taken more time to be listed, and some have been reclassified or delisted since then.
Northeast
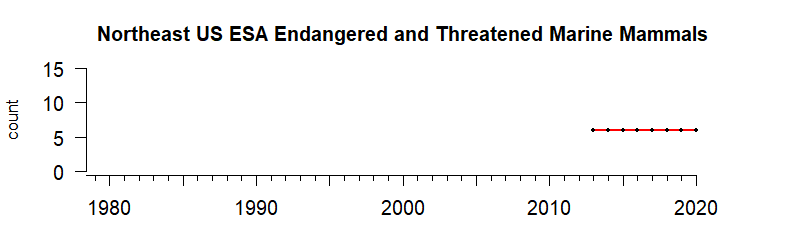
Values Correspond to the Number of ESA Threatened or Endangered Species in a given region
Data Interpretation
Gauge and Trend Analyses were not appropriate for marine mammal data.
Data Background and Caveats
NOAA Fisheries goes through required regulatory steps to list, reclassify, or delist a species under the ESA. For more information, see a step-by-step description of the ESA listing process. The listing process requires time and resources; as a result, the timing and number of listed marine species is not necessarily indicative of the actual number of currently endangered or threatened species and the exact timing of when these species became eligible to be listed under the ESA. Many marine species were initially listed when the ESA was passed in 1973; others have taken more time to be listed, and some have been reclassified or delisted since then.
Marine mammal stocks considered strategic/depleted under the Marine Mammal Protection Act
Alaska
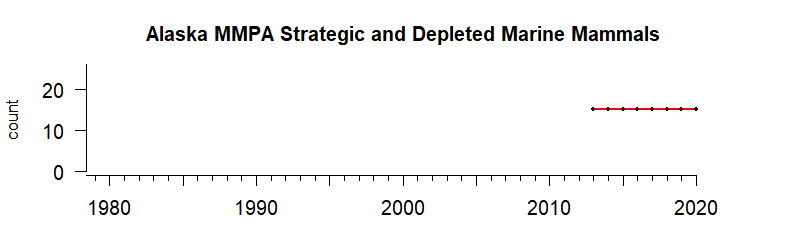
Values correspond to the number of MMPA Strategic or Depleted Marine Mammal Species listed each year in each region
Data Interpretation
Gauge and Trend Analyses were not appropriate for marine mammal data.
Data Background and Caveats
NOAA Fisheries prepares marine mammal stock assessment reports to track the status of marine mammal stocks. Some marine mammal stocks are thriving, while others are declining, and we often don’t know all the reasons behind a species or stock’s population trend. Because of this variability, it is difficult to indicate the state of an ecosystem or specific region using stock assessment data for marine mammal species that often range across multiple ecosystems and regions.
Hawai'i-Pacific Islands
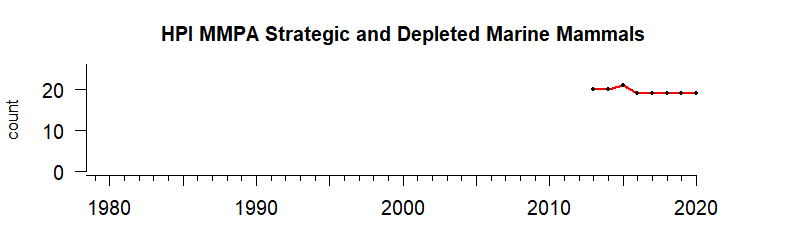
Values correspond to the number of MMPA Strategic or Depleted Marine Mammal Species listed each year in each region
Data Interpretation
Gauge and Trend Analyses were not appropriate for marine mammal data.
Data Background and Caveats
NOAA Fisheries prepares marine mammal stock assessment reports to track the status of marine mammal stocks. Some marine mammal stocks are thriving, while others are declining, and we often don’t know all the reasons behind a species or stock’s population trend. Because of this variability, it is difficult to indicate the state of an ecosystem or specific region using stock assessment data for marine mammal species that often range across multiple ecosystems and regions.
California Current
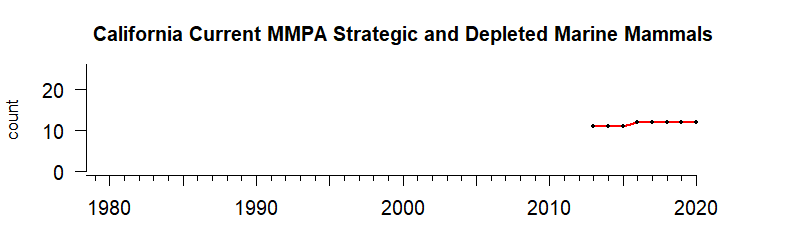
Values correspond to the number of MMPA Strategic or Depleted Marine Mammal Species listed each year in each region
Data Interpretation
Gauge and Trend Analyses were not appropriate for marine mammal data.
Data Background and Caveats
NOAA Fisheries prepares marine mammal stock assessment reports to track the status of marine mammal stocks. Some marine mammal stocks are thriving, while others are declining, and we often don’t know all the reasons behind a species or stock’s population trend. Because of this variability, it is difficult to indicate the state of an ecosystem or specific region using stock assessment data for marine mammal species that often range across multiple ecosystems and regions.
Southeast and Gulf of Mexico
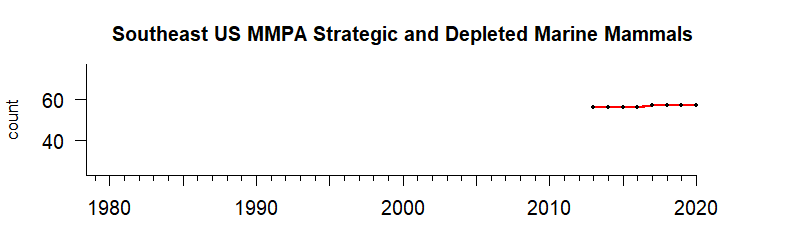
Values correspond to the number of MMPA Strategic or Depleted Marine Mammal Species listed each year in each region
Data Interpretation
Gauge and Trend Analyses were not appropriate for marine mammal data.
Data Background and Caveats
NOAA Fisheries prepares marine mammal stock assessment reports to track the status of marine mammal stocks. Some marine mammal stocks are thriving, while others are declining, and we often don’t know all the reasons behind a species or stock’s population trend. Because of this variability, it is difficult to indicate the state of an ecosystem or specific region using stock assessment data for marine mammal species that often range across multiple ecosystems and regions.
Northeast
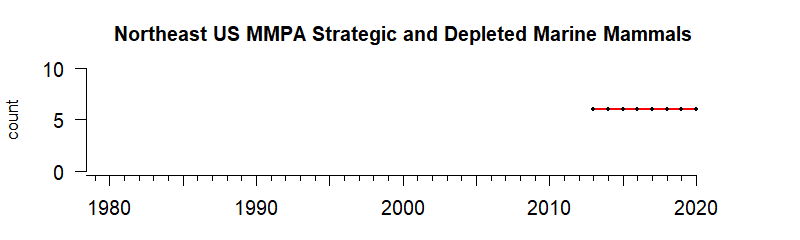
Values correspond to the number of MMPA Strategic or Depleted Marine Mammal Species listed each year in each region
Data Interpretation
Gauge and Trend Analyses were not appropriate for marine mammal data.
Data Background and Caveats
NOAA Fisheries prepares marine mammal stock assessment reports to track the status of marine mammal stocks. Some marine mammal stocks are thriving, while others are declining, and we often don’t know all the reasons behind a species or stock’s population trend. Because of this variability, it is difficult to indicate the state of an ecosystem or specific region using stock assessment data for marine mammal species that often range across multiple ecosystems and regions.

Resources
Directory of Endangered and Threatened species
NOAA Fisheries has jurisdiction over 165 endangered and threatened marine species (80 endangered; 85 threatened), including 66 foreign species (40 endangered; 26 threatened). This website serves as a directory for them.

Marine Mammal Stock Assessments
Assessing marine mammal stocks gives us valuable information on population trends, productivity rates, estimates of human-caused mortality and other sources of serious injury, and more. These assessments allow us to evaluate the effectiveness of conservation and recovery measures, and to adjust management approaches as needed.
