
Description of Coastal Population:
While marine ecosystems are important for people all across the country, they are essential for people living in coastal communities. The population density of coastal counties is over six times greater than inland counties. In the U.S. coastal counties make up less than 10 percent of the total land area (not including Alaska), but account for 39 percent of the total population. From 1970 to 2010, the population of these counties increased by almost 40% and are projected to increase by over 10 million people or 8+% into the 2020s.
The population density of an area is an important factor for economic planning, emergency preparedness, understanding environmental impacts, resource demand, and many other reasons. Thus, this indicator is important to track. We present the number of residents within all regions.
Data Source:
Coastal population data was retrieved from the Census Bureau’s county population totals, filtered to present coastal counties using the Census Bureau’s list of coastal counties within each state. Coastal county populations were then summed within each region for reporting purposes. Note: The 2020 American Community Survey Data Release has been delayed - data on this website will be updated with 2020 estimates as soon as possible.
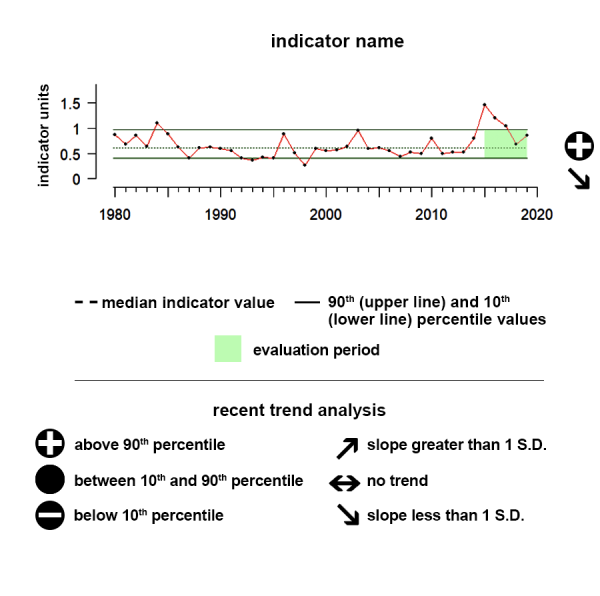
Understanding the Time series plots
Time series plots show the changes in each indicator as a function of time, over the period 1980-present. Each plot also shows horizontal lines that indicate the median (middle) value of that indicator, as well as the 10th and 90th percentiles, each calculated for the entire period of measurement. Time series plots were only developed for datasets with at least 10 years of data. Two symbols located to the right of each plot describe how recent values of an indicator compare against the overall series. A black circle indicates whether the indicator values over the last five years are on average above the series 90th percentile (plus sign), below the 10th percentile (minus sign), or between those two values (solid circle). Beneath that an arrow reflects the trend of the indicator over the last five years; an increase or decrease greater than one standard deviation is reflected in upward or downward arrows respectively, while a change of less than one standard deviation is recorded by a left-right arrow.
Alaska
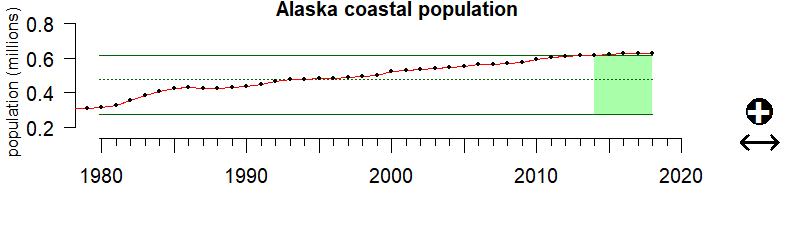
Values correspond to the total coastal population for a given region
Description of time series:
Alaska’s average coastal population between 2014 – 2018 was substantially above historic levels, although the recent trend is not different from historical trends.
Description of gauge:
The average coastal population in Alaska between 2014 and 2018 was greater than 92% of all population levels between 1970 to 2018, again highlighting the substantial growth in the coastal population of this state.
Extreme Gauge values:
A value of zero on the gauge means that the average coastal population over the last 5 years of data was below any annual population level up until that point, while a value of 100 would indicate the average over that same period was above any annual population level up until that point.
Indicator Source Information:
The American Community Survey (ACS) helps local officials, community leaders, and businesses understand the changes taking place in their communities. It is the premier source for detailed population and housing information about our nation. The 2020 ACS Data Update will be publicly available no later than November 30, 2021.
Data Background and Caveats:
The values represented here are coastal county population estimates for states bordering US Large Marine Ecosystems as calculated by the US Census Bureau from the American Community Survey.
Hawai'i-Pacific Islands
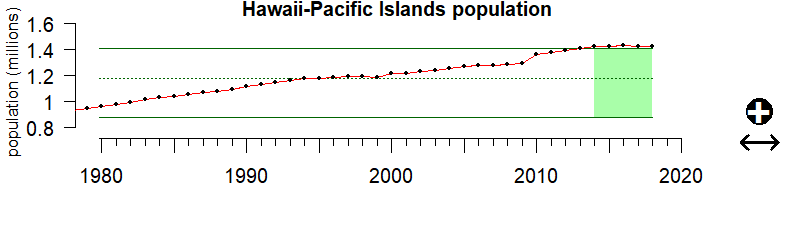
Values correspond to the total coastal population for a given region
Description of time series:
The 2014 – 2018 average coastal population in Hawaii was substantially above historic levels, although the recent trend is not different from historical trends.
Description of gauge:
The average coastal population in Hawaii between 2014 and 2018 was greater than 96% of all population levels between 1970 to 2018, again highlighting the substantial growth in the coastal population of this region.
Extreme Gauge values:
A value of zero on the gauge means that the average coastal population over the last 5 years of data was below any annual population level up until that point, while a value of 100 would indicate the average over that same period was above any annual population level up until that point.
Indicator Source Information:
The American Community Survey (ACS) helps local officials, community leaders, and businesses understand the changes taking place in their communities. It is the premier source for detailed population and housing information about our nation. The 2020 ACS Data Update will be publicly available no later than November 30, 2021.
Data Background and Caveats:
The values represented here are coastal county population estimates for states bordering US Large Marine Ecosystems as calculated by the US Census Bureau from the American Community Survey.
California Current
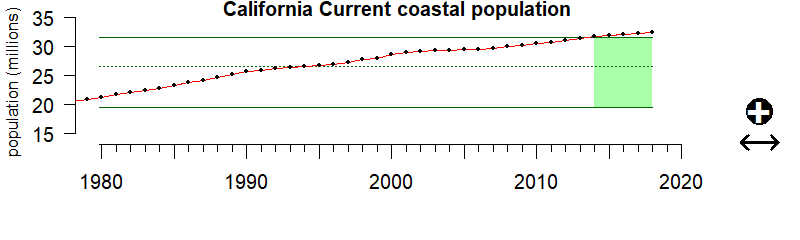
Values correspond to the total coastal population for a given region
Description of time series:
The 2014 – 2018 average coastal population in the California Current ecosystem was substantially above historic levels, although the recent trend is not different from historical trends.
Description of gauge:
The 2014 – 2018 average coastal population within the California Current ecosystem was greater than 94% of all population levels between 1970 to 2018, again highlighting the substantial growth in the coastal population of this region.
Extreme Gauge values:
A value of zero on the gauge means that the average coastal population over the last 5 years of data was below any annual population level up until that point, while a value of 100 would indicate the average over that same period was above any annual population level up until that point.
Indicator Source Information:
The American Community Survey (ACS) helps local officials, community leaders, and businesses understand the changes taking place in their communities. It is the premier source for detailed population and housing information about our nation. The 2020 ACS Data Update will be publicly available no later than November 30, 2021.
Data Background and Caveats:
The values represented here are coastal county population estimates for states bordering US Large Marine Ecosystems as calculated by the US Census Bureau from the American Community Survey.
Gulf of Mexico
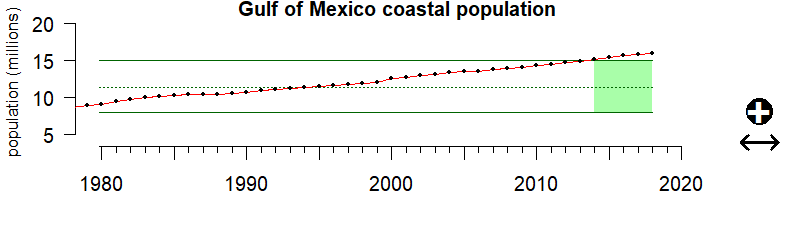
Values correspond to the total coastal population for a given region
Description of time series:
The 2014 – 2018 average coastal population along the Gulf of Mexico was substantially above historic levels, although the recent trend is not different from historical trends.
Description of gauge:
The 2014 – 2018 average coastal population along the Gulf of Mexico was greater than 94% of all population levels between 1970 to 2018, again highlighting the substantial growth in the coastal population of this region.
Extreme Gauge values:
A value of zero on the gauge means that the average coastal population over the last 5 years of data was below any annual population level up until that point, while a value of 100 would indicate the average over that same period was above any annual population level up until that point.
Indicator Source Information:
The American Community Survey (ACS) helps local officials, community leaders, and businesses understand the changes taking place in their communities. It is the premier source for detailed population and housing information about our nation. The 2020 ACS Data Update will be publicly available no later than November 30, 2021.
Data Background and Caveats:
The values represented here are coastal county population estimates for states bordering US Large Marine Ecosystems as calculated by the US Census Bureau from the American Community Survey.
Southeast
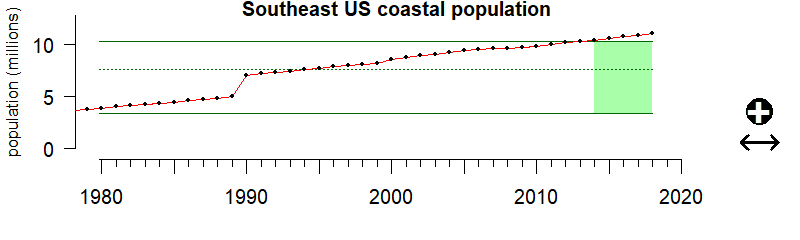
Values correspond to the total coastal population for a given region
Description of time series:
The 2014 – 2018 average coastal population in the Southeast was substantially above historic levels, although the recent trend is not different from historical trends.
Description of gauge:
The 2014 – 2018 average coastal population within the Southeast was greater than 94% of all population levels between 1970 to 2018, again highlighting the substantial growth in the coastal population of this region.
Extreme Gauge values:
A value of zero on the gauge means that the average coastal population over the last 5 years of data was below any annual population level up until that point, while a value of 100 would indicate the average over that same period was above any annual population level up until that point.
Indicator Source Information:
The American Community Survey (ACS) helps local officials, community leaders, and businesses understand the changes taking place in their communities. It is the premier source for detailed population and housing information about our nation. The 2020 ACS Data Update will be publicly available no later than November 30, 2021.
Data Background and Caveats:
The values represented here are coastal county population estimates for states bordering US Large Marine Ecosystems as calculated by the US Census Bureau from the American Community Survey.
Northeast
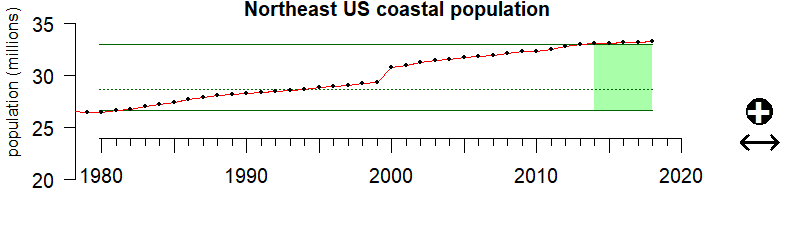
Values correspond to the total coastal population for a given region
Description of time series:
The 2014 – 2018 average coastal population in the Northeast was substantially above historic levels, although the recent trend is not different from historical trends.
Description of gauge:
The 2014 – 2018 average coastal population within the Northeast was greater than 94% of all population levels between 1970 to 2018, again highlighting the substantial growth in the coastal population of this region.
Extreme Gauge values:
A value of zero on the gauge means that the average coastal population over the last 5 years of data was below any annual population level up until that point, while a value of 100 would indicate the average over that same period was above any annual population level up until that point.
Indicator Source Information:
The American Community Survey (ACS) helps local officials, community leaders, and businesses understand the changes taking place in their communities. It is the premier source for detailed population and housing information about our nation. The 2020 ACS Data Update will be publicly available no later than November 30, 2021.
Data Background and Caveats:
The values represented here are coastal county population estimates for states bordering US Large Marine Ecosystems as calculated by the US Census Bureau from the American Community Survey.

Census U.S. Intercensal County Population Data, 1970-2014
The Census Bureau's Population Estimates Program publishes population estimates each year.

Explore Census Data
The Census Bureau is the leading source of quality data about the nation's people and economy.

NOAA Report on the Ocean and Great Lakes Economy of the United States
This report examines the critically important economic contributions of the oceans and Great Lakes. The report presents the NOAA Office for Coastal Management’s Economics: National Ocean Watch (ENOW) data set, and includes a variety of infographics at the national, regional, and state levels.

NMFS Community Vulnerability
We conduct research to better understand the impacts of management decisions on our nation’s vital fishing communities. Each region creates fishing community profiles, which contain social and economic data. Social indicators are used to help assess community resilience and vulnerability.

NOAA Economic National Ocean Watch data base -
The Economics: National Ocean Watch (ENOW) data set features time-series data focused on the six economic sectors that are dependent on the oceans and Great Lakes. ENOW is available for counties, states, regions, and the nation in a wide variety of formats.
