Description of Commercial Fishing (Landings and Revenue):
Commercial landings are the weight of, or revenue from, fish that are caught, brought to shore, processed, and sold for profit. It does not include sport or subsistence (to feed themselves) fishermen or for-hire sector, which earns its revenue from selling recreational fishing trips to saltwater anglers.
Commercial landings make up a major part of coastal economies. U.S. commercial fisheries are among the world’s largest and most sustainable; producing seafood, fish meal, vitamin supplements, and a host of other products for both domestic and international consumers.
The weight (tonnage), and revenue from the sale of commercial landings provides data on the ability of marine ecosystems to continue to supply these important products.
Data Source:
Commercial landings and gross revenue were downloaded from the National Marine Fisheries Service’s annual commercial fisheries landings query tool which can be found here. State pounds landed and revenue generated were aggregated to the appropriate region, and all revenue data was deflated to 2020 constant dollars using the Bureau of Labor Statistic’s Consumer Price Index (series CUUR0000SA0).
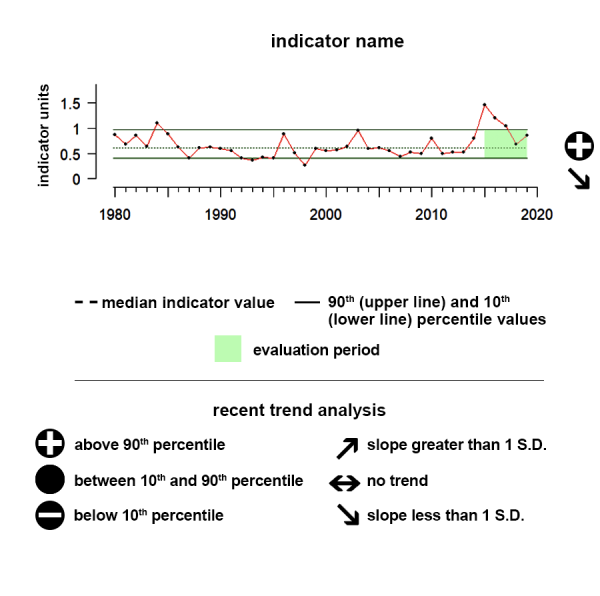
Understanding the Time series plots
Time series plots show the changes in each indicator as a function of time, over the period 1980-present. Each plot also shows horizontal lines that indicate the median (middle) value of that indicator, as well as the 10th and 90th percentiles, each calculated for the entire period of measurement. Time series plots were only developed for datasets with at least 10 years of data. Two symbols located to the right of each plot describe how recent values of an indicator compare against the overall series. A black circle indicates whether the indicator values over the last five years are on average above the series 90th percentile (plus sign), below the 10th percentile (minus sign), or between those two values (solid circle). Beneath that an arrow reflects the trend of the indicator over the last five years; an increase or decrease greater than one standard deviation is reflected in upward or downward arrows respectively, while a change of less than one standard deviation is recorded by a left-right arrow.
Alaska
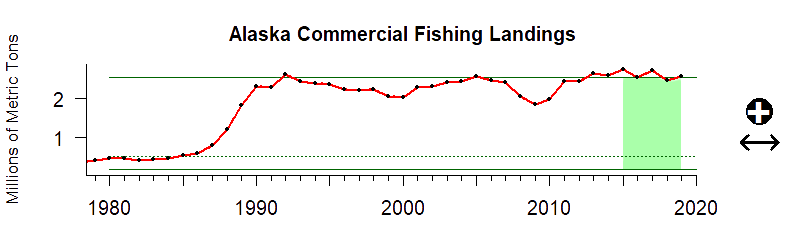
Values correspond to landings in millions of metric tons
Description of time series:
Between 2015 and 2019, commercial landings from Alaska are substantially above historic levels, although there is no recent trend apparent.
Description of gauge:
The gauge value of 94 indicates that the mean annual commercial landings between 2015 and 2019 for Alaska was higher than 94% of all years between 1950 and 2019
Extreme Gauge values:
A value of zero on the gauge means that the average revenue or landings over the last 5 years of data was below any annual value up until that point, while a value of 100 would indicate the average value over that same period was above any annual value up until that point.
Indicator Source Information:
Landings are reported in pounds of round (live) weight for all species or groups except univalve and bivalve mollusks, such as clams, mussels, oysters and scallops, which are reported as pounds of meats (excludes shell weight). Landings data may sometimes differ from state-reported landings due to our reporting of mollusks in meat weights rather than gallons, shell weight, or bushels. Also, NMFS includes some species such as kelp and oysters that are sometimes reported by state agricultural agencies and may not be included with state fishery agency landings data.
Data Background and Caveats:
All landings summaries will return only non confidential landing statistics. Federal statutes prohibit public disclosure of landings (or other information) that would allow identification of the data contributors and possibly put them at a competitive disadvantage. Most summarized landings are non confidential, but whenever confidential landings occur they have been combined with other landings and usually reported as "Withheld for Confidentiality" Total landings by state include confidential data and will be accurate, but landings reported by individual species may, in some instances, be misleading due to data confidentiality.
Landings data do not indicate the physical location of harvest but the location at which the landings either first crossed the dock or were reported from.
Many fishery products are gutted or otherwise processed while at sea and are landed in a product type other than round (whole) weight. Our data partners have standard conversion factors for the majority of the commonly caught species that convert their landing weights from any product type to whole weight. It is the whole weight that is displayed in our web site landing statistics. Caution should be exercised when using these statistics. An example of a potential problem is when landings statistics are used to monitor fishery quotas. In some situations, specific conversion factors may have been designated in fishery management plans or Federal rule making that differ from those historically used by NOAA Fisheries in reporting landings statistics.
The dollar value of the landings are ex-vessel (as paid to the fisherman at time of first sale) and are reported as nominal (current at the time of reporting) values. Users can use the Consumer Price Index (CPI) or the Producer Price Index (PPI) to convert these nominal landing values into real (deflated) values.
Landings do not include aquaculture products except for clams, mussels and oysters.
Pacific landings summarized by state include an artificial “state” designation of “At-Sea Process, Pac.” This designation was assigned to landings consisting of primarily whiting caught in the EEZ off Washington and Oregon that were processed aboard large vessels while at sea. No Pacific state lists these fish on their trip tickets which are used to report state fishery landing, hence the at-sea processor designation was used to insure that they would be listed as a U.S. landing.
Landing summaries are compiled from data bases that overlap in time and geographic coverage, and come from both within and outside of NOAA Fisheries.
Hawaiʻi
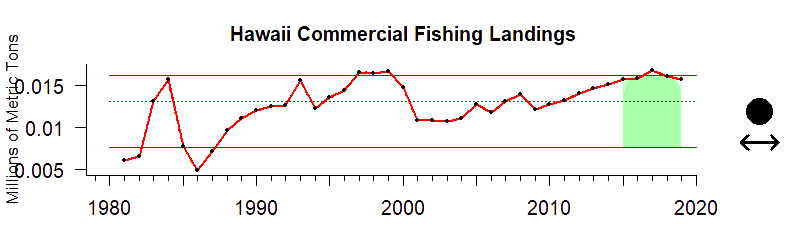
Values correspond to landings in millions of metric tons
Description of time series:
Commercial landings from Hawai’i between 2015 and 2019 were similar to historical patterns of landings, with no trend apparent.
Description of gauge:
The gauge value of 87 indicates that the mean annual commercial landings between 2015 and 2019 for Hawaii and the Pacific Islands was higher than 87% of all years between 1981 and 2019
Extreme Gauge values:
A value of zero on the gauge means that the average revenue or landings over the last 5 years of data was below any annual value up until that point, while a value of 100 would indicate the average value over that same period was above any annual value up until that point.
Indicator Source Information:
Landings are reported in pounds of round (live) weight for all species or groups except univalve and bivalve mollusks, such as clams, mussels, oysters and scallops, which are reported as pounds of meats (excludes shell weight). Landings data may sometimes differ from state-reported landings due to our reporting of mollusks in meat weights rather than gallons, shell weight, or bushels. Also, NMFS includes some species such as kelp and oysters that are sometimes reported by state agricultural agencies and may not be included with state fishery agency landings data.
Data Background and Caveats:
All landings summaries will return only non confidential landing statistics. Federal statutes prohibit public disclosure of landings (or other information) that would allow identification of the data contributors and possibly put them at a competitive disadvantage. Most summarized landings are non confidential, but whenever confidential landings occur they have been combined with other landings and usually reported as "Withheld for Confidentiality" Total landings by state include confidential data and will be accurate, but landings reported by individual species may, in some instances, be misleading due to data confidentiality.
Landings data do not indicate the physical location of harvest but the location at which the landings either first crossed the dock or were reported from.
Many fishery products are gutted or otherwise processed while at sea and are landed in a product type other than round (whole) weight. Our data partners have standard conversion factors for the majority of the commonly caught species that convert their landing weights from any product type to whole weight. It is the whole weight that is displayed in our web site landing statistics. Caution should be exercised when using these statistics. An example of a potential problem is when landings statistics are used to monitor fishery quotas. In some situations, specific conversion factors may have been designated in fishery management plans or Federal rule making that differ from those historically used by NOAA Fisheries in reporting landings statistics.
The dollar value of the landings are ex-vessel (as paid to the fisherman at time of first sale) and are reported as nominal (current at the time of reporting) values. Users can use the Consumer Price Index (CPI) or the Producer Price Index (PPI) to convert these nominal landing values into real (deflated) values.
Landings do not include aquaculture products except for clams, mussels and oysters.
Pacific landings summarized by state include an artificial “state” designation of “At-Sea Process, Pac.” This designation was assigned to landings consisting of primarily whiting caught in the EEZ off Washington and Oregon that were processed aboard large vessels while at sea. No Pacific state lists these fish on their trip tickets which are used to report state fishery landing, hence the at-sea processor designation was used to insure that they would be listed as a U.S. landing.
Landing summaries are compiled from data bases that overlap in time and geographic coverage, and come from both within and outside of NOAA Fisheries.
California Current
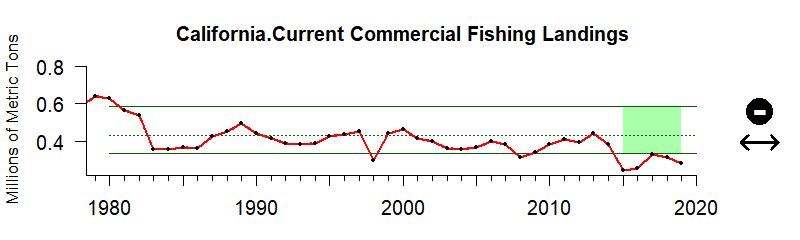
Values correspond to landings in millions of metric tons
Description of time series:
Between 2015 and 2019, commercial landings from the California Current ecosystem were substantially below historic levels, with no apparent trend
Description of gauge:
The gauge value of 4 indicates that the mean annual commercial landings between 2015 and 2019 for the California Current was higher than 4% of all years between 1950 and 2019
Extreme Gauge values:
A value of zero on the gauge means that the average revenue or landings over the last 5 years of data was below any annual value up until that point, while a value of 100 would indicate the average value over that same period was above any annual value up until that point.
Indicator Source Information:
Landings are reported in pounds of round (live) weight for all species or groups except univalve and bivalve mollusks, such as clams, mussels, oysters and scallops, which are reported as pounds of meats (excludes shell weight). Landings data may sometimes differ from state-reported landings due to our reporting of mollusks in meat weights rather than gallons, shell weight, or bushels. Also, NMFS includes some species such as kelp and oysters that are sometimes reported by state agricultural agencies and may not be included with state fishery agency landings data.
Data Background and Caveats:
All landings summaries will return only non confidential landing statistics. Federal statutes prohibit public disclosure of landings (or other information) that would allow identification of the data contributors and possibly put them at a competitive disadvantage. Most summarized landings are non confidential, but whenever confidential landings occur they have been combined with other landings and usually reported as "Withheld for Confidentiality" Total landings by state include confidential data and will be accurate, but landings reported by individual species may, in some instances, be misleading due to data confidentiality.
Landings data do not indicate the physical location of harvest but the location at which the landings either first crossed the dock or were reported from.
Many fishery products are gutted or otherwise processed while at sea and are landed in a product type other than round (whole) weight. Our data partners have standard conversion factors for the majority of the commonly caught species that convert their landing weights from any product type to whole weight. It is the whole weight that is displayed in our web site landing statistics. Caution should be exercised when using these statistics. An example of a potential problem is when landings statistics are used to monitor fishery quotas. In some situations, specific conversion factors may have been designated in fishery management plans or Federal rule making that differ from those historically used by NOAA Fisheries in reporting landings statistics.
The dollar value of the landings are ex-vessel (as paid to the fisherman at time of first sale) and are reported as nominal (current at the time of reporting) values. Users can use the Consumer Price Index (CPI) or the Producer Price Index (PPI) to convert these nominal landing values into real (deflated) values.
Landings do not include aquaculture products except for clams, mussels and oysters.
Pacific landings summarized by state include an artificial “state” designation of “At-Sea Process, Pac.” This designation was assigned to landings consisting of primarily whiting caught in the EEZ off Washington and Oregon that were processed aboard large vessels while at sea. No Pacific state lists these fish on their trip tickets which are used to report state fishery landing, hence the at-sea processor designation was used to insure that they would be listed as a U.S. landing.
Landing summaries are compiled from data bases that overlap in time and geographic coverage, and come from both within and outside of NOAA Fisheries.
Gulf of Mexico
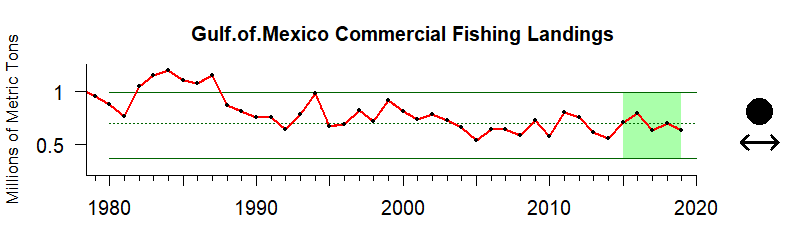
Values correspond to landings in millions of metric tons
Description of time series:
Between 2015 and 2019, commercial landings from the Gulf of Mexico were similar to historic levels, and there is no recent trend apparent.
Description of gauge:
The gauge value of 47 indicates that the mean annual commercial landings between 2015 and 2019 for the Gulf of Mexico was higher than 47% of all years between 1950 and 2019
Extreme Gauge values:
A value of zero on the gauge means that the average revenue or landings over the last 5 years of data was below any annual value up until that point, while a value of 100 would indicate the average value over that same period was above any annual value up until that point.
Indicator Source Information:
Landings are reported in pounds of round (live) weight for all species or groups except univalve and bivalve mollusks, such as clams, mussels, oysters and scallops, which are reported as pounds of meats (excludes shell weight). Landings data may sometimes differ from state-reported landings due to our reporting of mollusks in meat weights rather than gallons, shell weight, or bushels. Also, NMFS includes some species such as kelp and oysters that are sometimes reported by state agricultural agencies and may not be included with state fishery agency landings data.
Data Background and Caveats:
All landings summaries will return only non confidential landing statistics. Federal statutes prohibit public disclosure of landings (or other information) that would allow identification of the data contributors and possibly put them at a competitive disadvantage. Most summarized landings are non confidential, but whenever confidential landings occur they have been combined with other landings and usually reported as "Withheld for Confidentiality" Total landings by state include confidential data and will be accurate, but landings reported by individual species may, in some instances, be misleading due to data confidentiality.
Landings data do not indicate the physical location of harvest but the location at which the landings either first crossed the dock or were reported from.
Many fishery products are gutted or otherwise processed while at sea and are landed in a product type other than round (whole) weight. Our data partners have standard conversion factors for the majority of the commonly caught species that convert their landing weights from any product type to whole weight. It is the whole weight that is displayed in our web site landing statistics. Caution should be exercised when using these statistics. An example of a potential problem is when landings statistics are used to monitor fishery quotas. In some situations, specific conversion factors may have been designated in fishery management plans or Federal rule making that differ from those historically used by NOAA Fisheries in reporting landings statistics.
The dollar value of the landings are ex-vessel (as paid to the fisherman at time of first sale) and are reported as nominal (current at the time of reporting) values. Users can use the Consumer Price Index (CPI) or the Producer Price Index (PPI) to convert these nominal landing values into real (deflated) values.
Landings do not include aquaculture products except for clams, mussels and oysters.
Pacific landings summarized by state include an artificial “state” designation of “At-Sea Process, Pac.” This designation was assigned to landings consisting of primarily whiting caught in the EEZ off Washington and Oregon that were processed aboard large vessels while at sea. No Pacific state lists these fish on their trip tickets which are used to report state fishery landing, hence the at-sea processor designation was used to insure that they would be listed as a U.S. landing.
Landing summaries are compiled from data bases that overlap in time and geographic coverage, and come from both within and outside of NOAA Fisheries.
Southeast
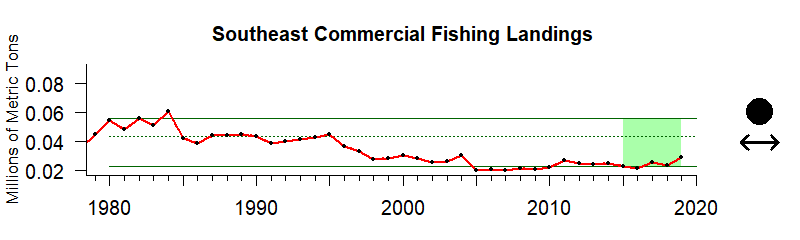
Values correspond to landings in millions of metric tons
Description of time series:
Between 2015 and 2019, commercial landings from the Southeast were similar to historic levels, and there is no recent trend apparent.
Description of gauge:
The gauge value of 14 indicates that the mean annual commercial landings between 2015 and 2019 for the Southeast US was higher than 14% of all years between 1950 and 2019
Extreme Gauge values:
A value of zero on the gauge means that the average revenue or landings over the last 5 years of data was below any annual value up until that point, while a value of 100 would indicate the average value over that same period was above any annual value up until that point.
Indicator Source Information:
Landings are reported in pounds of round (live) weight for all species or groups except univalve and bivalve mollusks, such as clams, mussels, oysters and scallops, which are reported as pounds of meats (excludes shell weight). Landings data may sometimes differ from state-reported landings due to our reporting of mollusks in meat weights rather than gallons, shell weight, or bushels. Also, NMFS includes some species such as kelp and oysters that are sometimes reported by state agricultural agencies and may not be included with state fishery agency landings data.
Data Background and Caveats:
All landings summaries will return only non confidential landing statistics. Federal statutes prohibit public disclosure of landings (or other information) that would allow identification of the data contributors and possibly put them at a competitive disadvantage. Most summarized landings are non confidential, but whenever confidential landings occur they have been combined with other landings and usually reported as "Withheld for Confidentiality" Total landings by state include confidential data and will be accurate, but landings reported by individual species may, in some instances, be misleading due to data confidentiality.
Landings data do not indicate the physical location of harvest but the location at which the landings either first crossed the dock or were reported from.
Many fishery products are gutted or otherwise processed while at sea and are landed in a product type other than round (whole) weight. Our data partners have standard conversion factors for the majority of the commonly caught species that convert their landing weights from any product type to whole weight. It is the whole weight that is displayed in our web site landing statistics. Caution should be exercised when using these statistics. An example of a potential problem is when landings statistics are used to monitor fishery quotas. In some situations, specific conversion factors may have been designated in fishery management plans or Federal rule making that differ from those historically used by NOAA Fisheries in reporting landings statistics.
The dollar value of the landings are ex-vessel (as paid to the fisherman at time of first sale) and are reported as nominal (current at the time of reporting) values. Users can use the Consumer Price Index (CPI) or the Producer Price Index (PPI) to convert these nominal landing values into real (deflated) values.
Landings do not include aquaculture products except for clams, mussels and oysters.
Pacific landings summarized by state include an artificial “state” designation of “At-Sea Process, Pac.” This designation was assigned to landings consisting of primarily whiting caught in the EEZ off Washington and Oregon that were processed aboard large vessels while at sea. No Pacific state lists these fish on their trip tickets which are used to report state fishery landing, hence the at-sea processor designation was used to insure that they would be listed as a U.S. landing.
Landing summaries are compiled from data bases that overlap in time and geographic coverage, and come from both within and outside of NOAA Fisheries.
Northeast
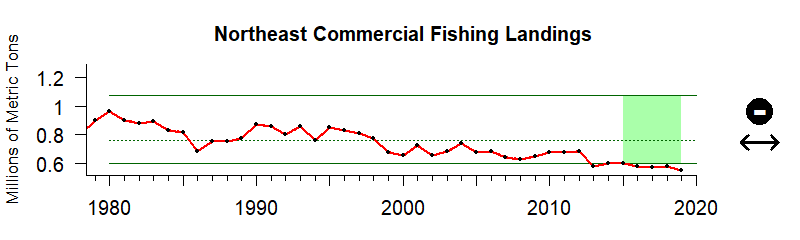
Values correspond to landings in millions of metric tons
Description of time series:
Between 2015 and 2019, commercial landings from the Northeast were substantially below historic levels, although there is no recent trend apparent.
Description of gauge:
The gauge value of 3 indicates that the mean annual commercial landings between 2015 and 2019 for the Northeast US was higher than 3% of all years between 1950 and 2019
Extreme Gauge values:
A value of zero on the gauge means that the average revenue or landings over the last 5 years of data was below any annual value up until that point, while a value of 100 would indicate the average value over that same period was above any annual value up until that point.
Indicator Source Information:
Landings are reported in pounds of round (live) weight for all species or groups except univalve and bivalve mollusks, such as clams, mussels, oysters and scallops, which are reported as pounds of meats (excludes shell weight). Landings data may sometimes differ from state-reported landings due to our reporting of mollusks in meat weights rather than gallons, shell weight, or bushels. Also, NMFS includes some species such as kelp and oysters that are sometimes reported by state agricultural agencies and may not be included with state fishery agency landings data.
Data Background and Caveats:
All landings summaries will return only non confidential landing statistics. Federal statutes prohibit public disclosure of landings (or other information) that would allow identification of the data contributors and possibly put them at a competitive disadvantage. Most summarized landings are non confidential, but whenever confidential landings occur they have been combined with other landings and usually reported as "Withheld for Confidentiality" Total landings by state include confidential data and will be accurate, but landings reported by individual species may, in some instances, be misleading due to data confidentiality.
Landings data do not indicate the physical location of harvest but the location at which the landings either first crossed the dock or were reported from.
Many fishery products are gutted or otherwise processed while at sea and are landed in a product type other than round (whole) weight. Our data partners have standard conversion factors for the majority of the commonly caught species that convert their landing weights from any product type to whole weight. It is the whole weight that is displayed in our web site landing statistics. Caution should be exercised when using these statistics. An example of a potential problem is when landings statistics are used to monitor fishery quotas. In some situations, specific conversion factors may have been designated in fishery management plans or Federal rule making that differ from those historically used by NOAA Fisheries in reporting landings statistics.
The dollar value of the landings are ex-vessel (as paid to the fisherman at time of first sale) and are reported as nominal (current at the time of reporting) values. Users can use the Consumer Price Index (CPI) or the Producer Price Index (PPI) to convert these nominal landing values into real (deflated) values.
Landings do not include aquaculture products except for clams, mussels and oysters.
Pacific landings summarized by state include an artificial “state” designation of “At-Sea Process, Pac.” This designation was assigned to landings consisting of primarily whiting caught in the EEZ off Washington and Oregon that were processed aboard large vessels while at sea. No Pacific state lists these fish on their trip tickets which are used to report state fishery landing, hence the at-sea processor designation was used to insure that they would be listed as a U.S. landing.
Landing summaries are compiled from data bases that overlap in time and geographic coverage, and come from both within and outside of NOAA Fisheries.
Alaska
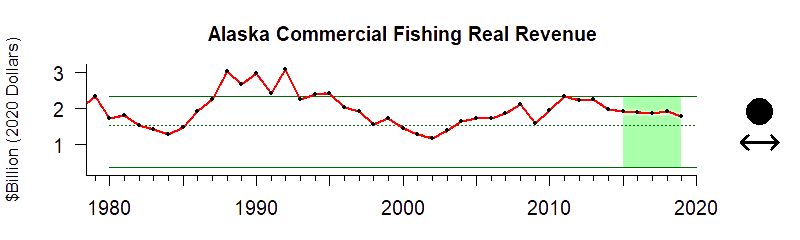
Values correspond to real revenue is 2020 US Dollars
Description of time series:
Commercial revenue from Alaska between 2015 and 2019 were not different from historical patterns, and there is no trend in values. Given that landings were at historically high levels for that same period, this suggests that the price per pound of fish is substantially lower than historical levels.
Description of gauge:
The gauge value of 67 indicates that the mean annual commercial revenue between 2015 and 2019 for Alaska was higher than 67% of all years between 1950 and 2019
Extreme Gauge values:
A value of zero on the gauge means that the average revenue or landings over the last 5 years of data was below any annual value up until that point, while a value of 100 would indicate the average value over that same period was above any annual value up until that point.
Indicator Source Information:
Landings are reported in pounds of round (live) weight for all species or groups except univalve and bivalve mollusks, such as clams, mussels, oysters and scallops, which are reported as pounds of meats (excludes shell weight). Landings data may sometimes differ from state-reported landings due to our reporting of mollusks in meat weights rather than gallons, shell weight, or bushels. Also, NMFS includes some species such as kelp and oysters that are sometimes reported by state agricultural agencies and may not be included with state fishery agency landings data.
Data Background and Caveats:
All landings summaries will return only non confidential landing statistics. Federal statutes prohibit public disclosure of landings (or other information) that would allow identification of the data contributors and possibly put them at a competitive disadvantage. Most summarized landings are non confidential, but whenever confidential landings occur they have been combined with other landings and usually reported as "Withheld for Confidentiality" Total landings by state include confidential data and will be accurate, but landings reported by individual species may, in some instances, be misleading due to data confidentiality.
Landings data do not indicate the physical location of harvest but the location at which the landings either first crossed the dock or were reported from.
Many fishery products are gutted or otherwise processed while at sea and are landed in a product type other than round (whole) weight. Our data partners have standard conversion factors for the majority of the commonly caught species that convert their landing weights from any product type to whole weight. It is the whole weight that is displayed in our web site landing statistics. Caution should be exercised when using these statistics. An example of a potential problem is when landings statistics are used to monitor fishery quotas. In some situations, specific conversion factors may have been designated in fishery management plans or Federal rule making that differ from those historically used by NOAA Fisheries in reporting landings statistics.
The dollar value of the landings are ex-vessel (as paid to the fisherman at time of first sale) and are reported as nominal (current at the time of reporting) values. Users can use the Consumer Price Index (CPI) or the Producer Price Index (PPI) to convert these nominal landing values into real (deflated) values.
Landings do not include aquaculture products except for clams, mussels and oysters.
Pacific landings summarized by state include an artificial “state” designation of “At-Sea Process, Pac.” This designation was assigned to landings consisting of primarily whiting caught in the EEZ off Washington and Oregon that were processed aboard large vessels while at sea. No Pacific state lists these fish on their trip tickets which are used to report state fishery landing, hence the at-sea processor designation was used to insure that they would be listed as a U.S. landing.
Landing summaries are compiled from data bases that overlap in time and geographic coverage, and come from both within and outside of NOAA Fisheries.
Hawaiʻi
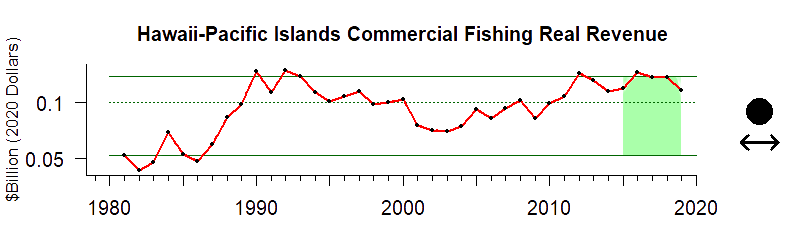
Values correspond to real revenue is 2020 US Dollars
Description of time series:
Commercial landings from Hawai’i between 2015 and 2019 were similar to historical patterns of landings, with no trend apparent.
Description of gauge:
The gauge value of 79 indicates that the mean annual commercial revenue between 2015 and 2019 for Hawai’i and the Pacific Islands was higher than 79% of all years between 1981 and 2019
Extreme Gauge values:
A value of zero on the gauge means that the average revenue or landings over the last 5 years of data was below any annual value up until that point, while a value of 100 would indicate the average value over that same period was above any annual value up until that point.
Indicator Source Information:
Landings are reported in pounds of round (live) weight for all species or groups except univalve and bivalve mollusks, such as clams, mussels, oysters and scallops, which are reported as pounds of meats (excludes shell weight). Landings data may sometimes differ from state-reported landings due to our reporting of mollusks in meat weights rather than gallons, shell weight, or bushels. Also, NMFS includes some species such as kelp and oysters that are sometimes reported by state agricultural agencies and may not be included with state fishery agency landings data.
Data Background and Caveats:
All landings summaries will return only non confidential landing statistics. Federal statutes prohibit public disclosure of landings (or other information) that would allow identification of the data contributors and possibly put them at a competitive disadvantage. Most summarized landings are non confidential, but whenever confidential landings occur they have been combined with other landings and usually reported as "Withheld for Confidentiality" Total landings by state include confidential data and will be accurate, but landings reported by individual species may, in some instances, be misleading due to data confidentiality.
Landings data do not indicate the physical location of harvest but the location at which the landings either first crossed the dock or were reported from.
Many fishery products are gutted or otherwise processed while at sea and are landed in a product type other than round (whole) weight. Our data partners have standard conversion factors for the majority of the commonly caught species that convert their landing weights from any product type to whole weight. It is the whole weight that is displayed in our web site landing statistics. Caution should be exercised when using these statistics. An example of a potential problem is when landings statistics are used to monitor fishery quotas. In some situations, specific conversion factors may have been designated in fishery management plans or Federal rule making that differ from those historically used by NOAA Fisheries in reporting landings statistics.
The dollar value of the landings are ex-vessel (as paid to the fisherman at time of first sale) and are reported as nominal (current at the time of reporting) values. Users can use the Consumer Price Index (CPI) or the Producer Price Index (PPI) to convert these nominal landing values into real (deflated) values.
Landings do not include aquaculture products except for clams, mussels and oysters.
Pacific landings summarized by state include an artificial “state” designation of “At-Sea Process, Pac.” This designation was assigned to landings consisting of primarily whiting caught in the EEZ off Washington and Oregon that were processed aboard large vessels while at sea. No Pacific state lists these fish on their trip tickets which are used to report state fishery landing, hence the at-sea processor designation was used to insure that they would be listed as a U.S. landing.
Landing summaries are compiled from data bases that overlap in time and geographic coverage, and come from both within and outside of NOAA Fisheries.
California Current
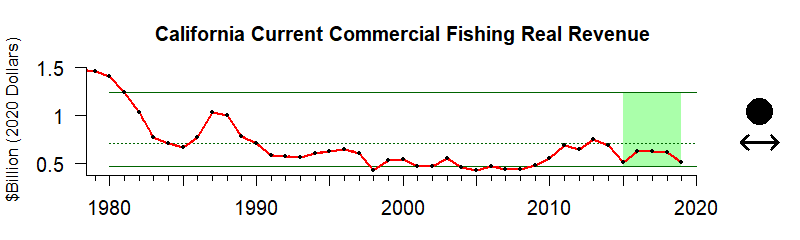
Values correspond to real revenue is 2020 US Dollars
Description of time series:
Commercial revenue from the California Current ecosystem between 2019 – 2013 was not different than historical patterns, and there is no trend in values. Given that landings were at historically low levels during that same period, the average price per pound of fish is substantially higher than historical levels
Description of gauge:
The gauge value of 24 indicates that the mean annual commercial revenue between 2015 and 2019 for the California Current was higher than 24% of all years between 1950 and 2019
Extreme Gauge values:
A value of zero on the gauge means that the average revenue or landings over the last 5 years of data was below any annual value up until that point, while a value of 100 would indicate the average value over that same period was above any annual value up until that point.
Indicator Source Information:
Landings are reported in pounds of round (live) weight for all species or groups except univalve and bivalve mollusks, such as clams, mussels, oysters and scallops, which are reported as pounds of meats (excludes shell weight). Landings data may sometimes differ from state-reported landings due to our reporting of mollusks in meat weights rather than gallons, shell weight, or bushels. Also, NMFS includes some species such as kelp and oysters that are sometimes reported by state agricultural agencies and may not be included with state fishery agency landings data.
Data Background and Caveats:
All landings summaries will return only non confidential landing statistics. Federal statutes prohibit public disclosure of landings (or other information) that would allow identification of the data contributors and possibly put them at a competitive disadvantage. Most summarized landings are non confidential, but whenever confidential landings occur they have been combined with other landings and usually reported as "Withheld for Confidentiality" Total landings by state include confidential data and will be accurate, but landings reported by individual species may, in some instances, be misleading due to data confidentiality.
Landings data do not indicate the physical location of harvest but the location at which the landings either first crossed the dock or were reported from.
Many fishery products are gutted or otherwise processed while at sea and are landed in a product type other than round (whole) weight. Our data partners have standard conversion factors for the majority of the commonly caught species that convert their landing weights from any product type to whole weight. It is the whole weight that is displayed in our web site landing statistics. Caution should be exercised when using these statistics. An example of a potential problem is when landings statistics are used to monitor fishery quotas. In some situations, specific conversion factors may have been designated in fishery management plans or Federal rule making that differ from those historically used by NOAA Fisheries in reporting landings statistics.
The dollar value of the landings are ex-vessel (as paid to the fisherman at time of first sale) and are reported as nominal (current at the time of reporting) values. Users can use the Consumer Price Index (CPI) or the Producer Price Index (PPI) to convert these nominal landing values into real (deflated) values.
Landings do not include aquaculture products except for clams, mussels and oysters.
Pacific landings summarized by state include an artificial “state” designation of “At-Sea Process, Pac.” This designation was assigned to landings consisting of primarily whiting caught in the EEZ off Washington and Oregon that were processed aboard large vessels while at sea. No Pacific state lists these fish on their trip tickets which are used to report state fishery landing, hence the at-sea processor designation was used to insure that they would be listed as a U.S. landing.
Landing summaries are compiled from data bases that overlap in time and geographic coverage, and come from both within and outside of NOAA Fisheries.
Gulf of Mexico
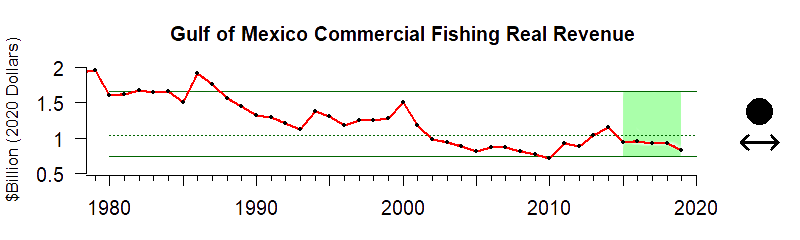
Values correspond to real revenue is 2020 US Dollars
Description of time series:
Between 2015 and 2019, average annual commercial revenue from the Gulf of Mexico was not different from historical patterns, and there is no trend in values.
Description of gauge:
The gauge value of 34 indicates that the mean annual commercial revenue between 2015 and 2019 for the Gulf of Mexico was higher than 34% of all years between 1950 and 2019
Extreme Gauge values:
A value of zero on the gauge means that the average revenue or landings over the last 5 years of data was below any annual value up until that point, while a value of 100 would indicate the average value over that same period was above any annual value up until that point.
Indicator Source Information:
Landings are reported in pounds of round (live) weight for all species or groups except univalve and bivalve mollusks, such as clams, mussels, oysters and scallops, which are reported as pounds of meats (excludes shell weight). Landings data may sometimes differ from state-reported landings due to our reporting of mollusks in meat weights rather than gallons, shell weight, or bushels. Also, NMFS includes some species such as kelp and oysters that are sometimes reported by state agricultural agencies and may not be included with state fishery agency landings data.
Data Background and Caveats:
All landings summaries will return only non confidential landing statistics. Federal statutes prohibit public disclosure of landings (or other information) that would allow identification of the data contributors and possibly put them at a competitive disadvantage. Most summarized landings are non confidential, but whenever confidential landings occur they have been combined with other landings and usually reported as "Withheld for Confidentiality" Total landings by state include confidential data and will be accurate, but landings reported by individual species may, in some instances, be misleading due to data confidentiality.
Landings data do not indicate the physical location of harvest but the location at which the landings either first crossed the dock or were reported from.
Many fishery products are gutted or otherwise processed while at sea and are landed in a product type other than round (whole) weight. Our data partners have standard conversion factors for the majority of the commonly caught species that convert their landing weights from any product type to whole weight. It is the whole weight that is displayed in our web site landing statistics. Caution should be exercised when using these statistics. An example of a potential problem is when landings statistics are used to monitor fishery quotas. In some situations, specific conversion factors may have been designated in fishery management plans or Federal rule making that differ from those historically used by NOAA Fisheries in reporting landings statistics.
The dollar value of the landings are ex-vessel (as paid to the fisherman at time of first sale) and are reported as nominal (current at the time of reporting) values. Users can use the Consumer Price Index (CPI) or the Producer Price Index (PPI) to convert these nominal landing values into real (deflated) values.
Landings do not include aquaculture products except for clams, mussels and oysters.
Pacific landings summarized by state include an artificial “state” designation of “At-Sea Process, Pac.” This designation was assigned to landings consisting of primarily whiting caught in the EEZ off Washington and Oregon that were processed aboard large vessels while at sea. No Pacific state lists these fish on their trip tickets which are used to report state fishery landing, hence the at-sea processor designation was used to insure that they would be listed as a U.S. landing.
Landing summaries are compiled from data bases that overlap in time and geographic coverage, and come from both within and outside of NOAA Fisheries.
Southeast
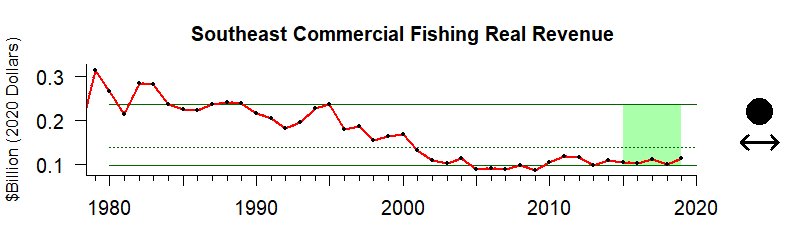
Values correspond to real revenue is 2020 US Dollars
Description of time series:
Between 2015 and 2019, average annual commercial revenue from the Southeast was not different than historical patterns, and there is no trend in values.
Description of gauge:
The gauge value of 23 indicates that the mean annual commercial revenue between 2015 and 2019 for the Southeast US was higher than 23% of all years between 1950 and 2019
Extreme Gauge values:
A value of zero on the gauge means that the average revenue or landings over the last 5 years of data was below any annual value up until that point, while a value of 100 would indicate the average value over that same period was above any annual value up until that point.
Indicator Source Information:
Landings are reported in pounds of round (live) weight for all species or groups except univalve and bivalve mollusks, such as clams, mussels, oysters and scallops, which are reported as pounds of meats (excludes shell weight). Landings data may sometimes differ from state-reported landings due to our reporting of mollusks in meat weights rather than gallons, shell weight, or bushels. Also, NMFS includes some species such as kelp and oysters that are sometimes reported by state agricultural agencies and may not be included with state fishery agency landings data.
Data Background and Caveats:
All landings summaries will return only non confidential landing statistics. Federal statutes prohibit public disclosure of landings (or other information) that would allow identification of the data contributors and possibly put them at a competitive disadvantage. Most summarized landings are non confidential, but whenever confidential landings occur they have been combined with other landings and usually reported as "Withheld for Confidentiality" Total landings by state include confidential data and will be accurate, but landings reported by individual species may, in some instances, be misleading due to data confidentiality.
Landings data do not indicate the physical location of harvest but the location at which the landings either first crossed the dock or were reported from.
Many fishery products are gutted or otherwise processed while at sea and are landed in a product type other than round (whole) weight. Our data partners have standard conversion factors for the majority of the commonly caught species that convert their landing weights from any product type to whole weight. It is the whole weight that is displayed in our web site landing statistics. Caution should be exercised when using these statistics. An example of a potential problem is when landings statistics are used to monitor fishery quotas. In some situations, specific conversion factors may have been designated in fishery management plans or Federal rule making that differ from those historically used by NOAA Fisheries in reporting landings statistics.
The dollar value of the landings are ex-vessel (as paid to the fisherman at time of first sale) and are reported as nominal (current at the time of reporting) values. Users can use the Consumer Price Index (CPI) or the Producer Price Index (PPI) to convert these nominal landing values into real (deflated) values.
Landings do not include aquaculture products except for clams, mussels and oysters.
Pacific landings summarized by state include an artificial “state” designation of “At-Sea Process, Pac.” This designation was assigned to landings consisting of primarily whiting caught in the EEZ off Washington and Oregon that were processed aboard large vessels while at sea. No Pacific state lists these fish on their trip tickets which are used to report state fishery landing, hence the at-sea processor designation was used to insure that they would be listed as a U.S. landing.
Landing summaries are compiled from data bases that overlap in time and geographic coverage, and come from both within and outside of NOAA Fisheries.
Northeast
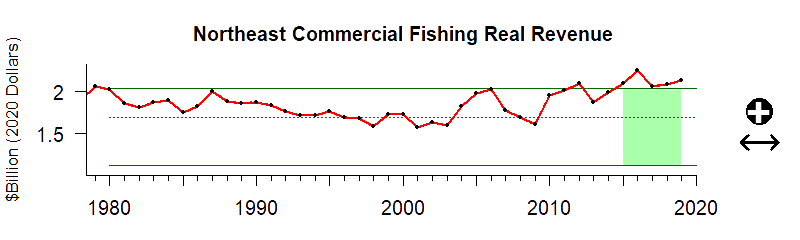
Values correspond to real revenue is 2020 US Dollars
Description of time series:
Between 2015 and 2019, average annual commercial revenue from the Northeast was substantially higher than historical patterns, although there is no trend in values. Given the historically low level of landings over that same period, the difference is derived from a substantially higher price per pound of fish received by fishermen
Description of gauge:
The gauge value of 97 indicates that the mean annual commercial revenue between 2015 and 2019 for the Northeast US was higher than 97% of all years between 1950 and 2019
Extreme Gauge values:
A value of zero on the gauge means that the average revenue or landings over the last 5 years of data was below any annual value up until that point, while a value of 100 would indicate the average value over that same period was above any annual value up until that point.
Indicator Source Information:
Landings are reported in pounds of round (live) weight for all species or groups except univalve and bivalve mollusks, such as clams, mussels, oysters and scallops, which are reported as pounds of meats (excludes shell weight). Landings data may sometimes differ from state-reported landings due to our reporting of mollusks in meat weights rather than gallons, shell weight, or bushels. Also, NMFS includes some species such as kelp and oysters that are sometimes reported by state agricultural agencies and may not be included with state fishery agency landings data.
Data Background and Caveats:
All landings summaries will return only non confidential landing statistics. Federal statutes prohibit public disclosure of landings (or other information) that would allow identification of the data contributors and possibly put them at a competitive disadvantage. Most summarized landings are non confidential, but whenever confidential landings occur they have been combined with other landings and usually reported as "Withheld for Confidentiality" Total landings by state include confidential data and will be accurate, but landings reported by individual species may, in some instances, be misleading due to data confidentiality.
Landings data do not indicate the physical location of harvest but the location at which the landings either first crossed the dock or were reported from.
Many fishery products are gutted or otherwise processed while at sea and are landed in a product type other than round (whole) weight. Our data partners have standard conversion factors for the majority of the commonly caught species that convert their landing weights from any product type to whole weight. It is the whole weight that is displayed in our web site landing statistics. Caution should be exercised when using these statistics. An example of a potential problem is when landings statistics are used to monitor fishery quotas. In some situations, specific conversion factors may have been designated in fishery management plans or Federal rule making that differ from those historically used by NOAA Fisheries in reporting landings statistics.
The dollar value of the landings are ex-vessel (as paid to the fisherman at time of first sale) and are reported as nominal (current at the time of reporting) values. Users can use the Consumer Price Index (CPI) or the Producer Price Index (PPI) to convert these nominal landing values into real (deflated) values.
Landings do not include aquaculture products except for clams, mussels and oysters.
Pacific landings summarized by state include an artificial “state” designation of “At-Sea Process, Pac.” This designation was assigned to landings consisting of primarily whiting caught in the EEZ off Washington and Oregon that were processed aboard large vessels while at sea. No Pacific state lists these fish on their trip tickets which are used to report state fishery landing, hence the at-sea processor designation was used to insure that they would be listed as a U.S. landing.
Landing summaries are compiled from data bases that overlap in time and geographic coverage, and come from both within and outside of NOAA Fisheries.

Resources
Commercial Landings database
Landing summaries are compiled from data bases that overlap in time and geographic coverage, and come from both within and outside of NOAA Fisheries.

NOAA Report on the Ocean and Great Lakes Economy of the United States
This report examines the critically important economic contributions of the oceans and Great Lakes. The report presents the NOAA Office for Coastal Management’s Economics: National Ocean Watch (ENOW) data set, and includes a variety of infographics at the national, regional, and state levels.

Fisheries of the United States
Each year NOAA Fisheries compiles key fisheries statistics from the previous year into an annual snapshot documenting fishing’s importance to the nation. The report provides landings totals for both domestic recreational and commercial fisheries by species and allows us to track important indicators such as annual seafood consumption and the productivity of top fishing ports.

NOAA Economic National Ocean Watch data base
The Economics: National Ocean Watch (ENOW) data set features time-series data focused on the six economic sectors that are dependent on the oceans and Great Lakes. ENOW is available for counties, states, regions, and the nation in a wide variety of formats.