
Description of Sea Surface Temperature:
Sea surface temperature (SST) is defined as the temperature of the top few millimeters of the ocean. This temperature directly or indirectly impacts the rate of all physical, chemical, and most biological processes occurring in the ocean. SST is globally monitored by sensors on satellites, buoys, ships, ocean reference stations, autonomous underwater vehicles (AUVs) and other technologies.
SST monitoring tells us how the ocean and atmosphere interact, as well as providing fundamental data on the global climate system. This information also aids us in weather prediction, i.e. identifying the onset of El Niño and La Niña cycles - multiyear shifts in atmospheric pressure and wind speeds. These shifts affect ocean circulation, global weather patterns, and marine ecosystems. SST anomalies have been linked to shifting marine resources. With warming temperatures, we observe the poleward movements of fish and other species. Temperature extremes—both ocean heatwaves and cold spells—have been linked to coral bleaching as well as fishery and aquaculture mortality. We present the annual average SST at the Large Marine Ecosystem scale in all regions.
Data Source:
The SST data were accessed from (https://www.ncdc.noaa.gov/oisst). The data are plotted in degrees Celsius.
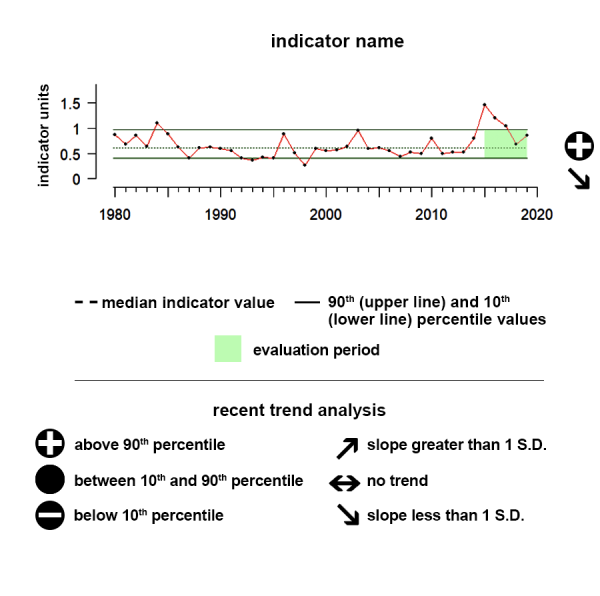
Understanding the Time series plots
Time series plots show the changes in each indicator as a function of time, over the period 1980-present. Each plot also shows horizontal lines that indicate the median (middle) value of that indicator, as well as the 10th and 90th percentiles, each calculated for the entire period of measurement. Time series plots were only developed for datasets with at least 10 years of data. Two symbols located to the right of each plot describe how recent values of an indicator compare against the overall series. A black circle indicates whether the indicator values over the last five years are on average above the series 90th percentile (plus sign), below the 10th percentile (minus sign), or between those two values (solid circle). Beneath that an arrow reflects the trend of the indicator over the last five years; an increase or decrease greater than one standard deviation is reflected in upward or downward arrows respectively, while a change of less than one standard deviation is recorded by a left-right arrow.
Alaska
Eastern Bering Sea
Sea surface temperature is defined as the average temperature of the top few millimeters of the ocean. Sea surface temperature monitoring tells us how the ocean and atmosphere interact, as well as providing fundamental data on the global climate system
Description of time series:
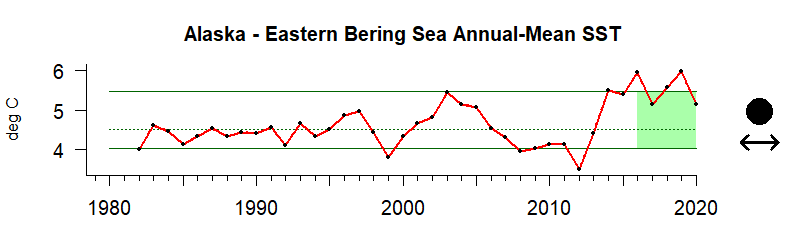
The time series shows the integrated sea surface temperature for Alaska’s Eastern Bering Sea region. During the last five years there has been no notable trend and values have remained within the 10th and 90th percentiles of all observed data in the time series.
Description of gauge:
The gauge value of 92 indicates that the mean sea surface temperature between 2016 and 2020 for the Eastern Bering Sea region was higher than 92% of the temperatures between 1982 and 2017.
Indicator and source information:
The SST data were accessed from (https://www.ncdc.noaa.gov/oisst). The data are plotted in degrees Celsius.
Data background and limitations:
To compensate for platform differences and sensor biases, satellite and ship observations are referenced to buoys. These data are NOAA 1/4° Daily Optimum Interpolation Sea Surface Temperature (version 2.1). Measurements of SST served through this portal incorporate data obtained from various platforms such as satellites, buoys, Argo floats, and ships.
Alaska
Gulf of Alaska
Sea surface temperature is defined as the average temperature of the top few millimeters of the ocean. Sea surface temperature monitoring tells us how the ocean and atmosphere interact, as well as providing fundamental data on the global climate system
Description of time series:
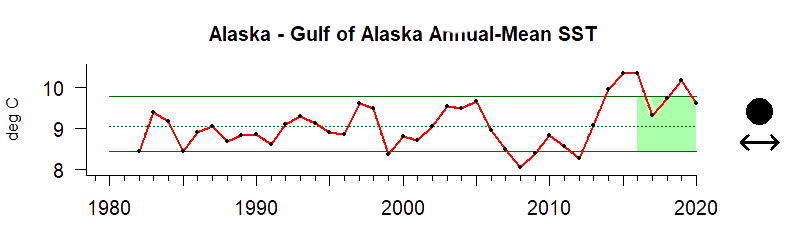
The time series shows the integrated sea surface temperature for Alaska’s Gulf of Alaska region. During the last five years there has been no notable trend while values have remained within the 10th and 90th percentiles of all observed data in the time series.
Description of gauge:
The gauge value of 90 indicates that the mean sea surface temperature between 2016 and 2020 for the Gulf of Alaska region was higher than 90% of the temperatures between 1982 and 2020.
Indicator and source information:
The SST data were accessed from (https://www.ncdc.noaa.gov/oisst). The data are plotted in degrees Celsius.
Data background and limitations:
To compensate for platform differences and sensor biases, satellite and ship observations are referenced to buoys. These data are NOAA 1/4° Daily Optimum Interpolation Sea Surface Temperature (version 2.1). Measurements of SST served through this portal incorporate data obtained from various platforms such as satellites, buoys, Argo floats, and ships.
Hawai'i
Sea surface temperature is defined as the average temperature of the top few millimeters of the ocean. Sea surface temperature monitoring tells us how the ocean and atmosphere interact, as well as providing fundamental data on the global climate system
Description of time series:
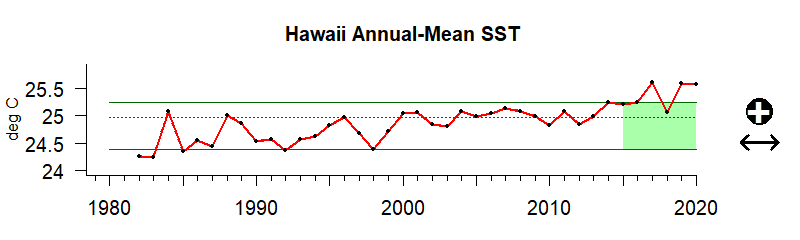
The time series shows the integrated sea surface temperature for the Hawai‘i region. During the last five years there has been no notable trend but values were above the 90th percentile of all observed data in the time series
Description of gauge:
The gauge value of 92 indicates that the mean sea surface temperature between 2016 and 2020 for the Hawai‘i region was higher than 92% of the temperatures between 1982 and 2020.
Indicator and source information:
The SST data were accessed from (https://www.ncdc.noaa.gov/oisst). The data are plotted in degrees Celsius.
Data background and limitations:
To compensate for platform differences and sensor biases, satellite and ship observations are referenced to buoys. These data are NOAA 1/4° Daily Optimum Interpolation Sea Surface Temperature (version 2.1). Measurements of SST served through this portal incorporate data obtained from various platforms such as satellites, buoys, Argo floats, and ships.
California Current
Sea surface temperature is defined as the average temperature of the top few millimeters of the ocean. Sea surface temperature monitoring tells us how the ocean and atmosphere interact, as well as providing fundamental data on the global climate system
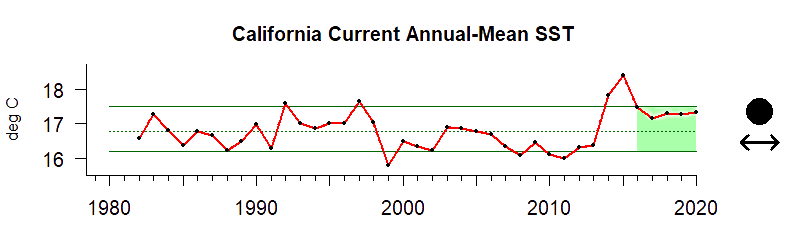
Description of time series:
The time series shows the integrated sea surface temperature for the California Current region. During the last five years there has been no notable trend and values have remained within the 10th and 90th percentiles.
Description of gauge:
The gauge value of 85 indicates that the mean sea surface temperature between 2016 and 2020 for the California Current region was higher than 85% of the temperatures between 1982 and 2020.
Indicator and source information:
The SST data were accessed from (https://www.ncdc.noaa.gov/oisst). The data are plotted in degrees Celsius.
Data background and limitations:
To compensate for platform differences and sensor biases, satellite and ship observations are referenced to buoys. These data are NOAA 1/4° Daily Optimum Interpolation Sea Surface Temperature (version 2.1). Measurements of SST served through this portal incorporate data obtained from various platforms such as satellites, buoys, Argo floats, and ships.
Gulf of Mexico
Sea surface temperature is defined as the average temperature of the top few millimeters of the ocean. Sea surface temperature monitoring tells us how the ocean and atmosphere interact, as well as providing fundamental data on the global climate system
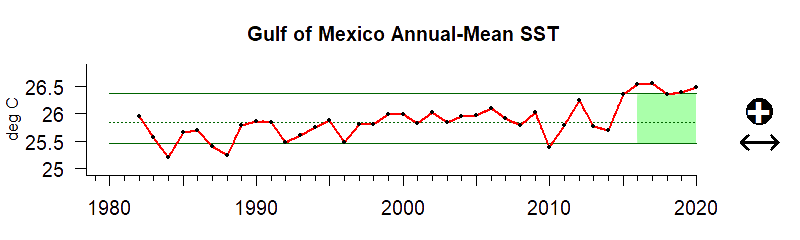
Description of time series:
The time series shows the integrated sea surface temperature for the Gulf of Mexico region. During the last five years there has been no notable trend but values were above the 90th percentile of all observed data in the time series.
Description of gauge:
The gauge value of 92 indicates that the mean sea surface temperature between 2016 and 2020 for the Gulf of Mexico region was higher than 92% of the temperatures between 1982 and 2020.
Indicator and source information:
The SST data were accessed from (https://www.ncdc.noaa.gov/oisst). The data are plotted in degrees Celsius.
Data background and limitations:
To compensate for platform differences and sensor biases, satellite and ship observations are referenced to buoys. These data are NOAA 1/4° Daily Optimum Interpolation Sea Surface Temperature (version 2.1). Measurements of SST served through this portal incorporate data obtained from various platforms such as satellites, buoys, Argo floats, and ships.
Caribbean
Sea surface temperature is defined as the average temperature of the top few millimeters of the ocean. Sea surface temperature monitoring tells us how the ocean and atmosphere interact, as well as providing fundamental data on the global climate system
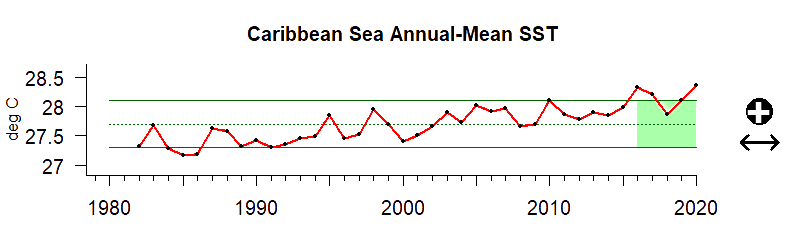
Description of time series:
The time series shows the integrated sea surface temperature for the Caribbean region. During the last five years there has been no notable trend but values were above the 90th percentile of all observed data in the time series.
Description of gauge:
The gauge value of 92 indicates that the mean sea surface temperature between 2016 and 2020 for the Caribbean region was higher than 92% of the temperatures between 1982 and 2020.
Indicator and source information:
The SST data were accessed from (https://www.ncdc.noaa.gov/oisst). The data are plotted in degrees Celsius.
Data background and limitations:
To compensate for platform differences and sensor biases, satellite and ship observations are referenced to buoys. These data are NOAA 1/4° Daily Optimum Interpolation Sea Surface Temperature (version 2.1). Measurements of SST served through this portal incorporate data obtained from various platforms such as satellites, buoys, Argo floats, and ships.
Southeast
Sea surface temperature is defined as the average temperature of the top few millimeters of the ocean. Sea surface temperature monitoring tells us how the ocean and atmosphere interact, as well as providing fundamental data on the global climate system
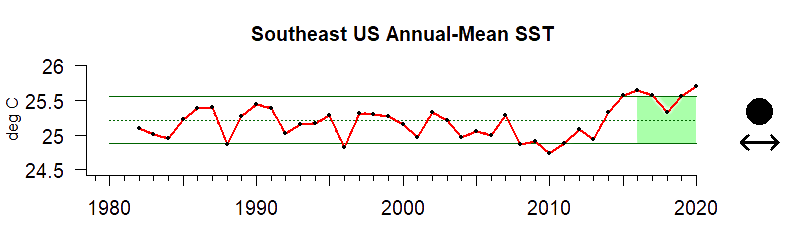
Description of time series:
The time series shows the integrated sea surface temperature for the Southeast US region. During the last five years there has been no notable trend and values have remained within the 10th and 90th percentiles of all observed data in the time series.
Description of gauge:
The gauge value of 90 indicates that the mean sea surface temperature between 2016 and 2020 for the Southeast US region was higher than 90% of the temperatures between 1982 and 2020.
Indicator and source information:
The SST data were accessed from (https://www.ncdc.noaa.gov/oisst). The data are plotted in degrees Celsius.
Data background and limitations:
To compensate for platform differences and sensor biases, satellite and ship observations are referenced to buoys. These data are NOAA 1/4° Daily Optimum Interpolation Sea Surface Temperature (version 2.1). Measurements of SST served through this portal incorporate data obtained from various platforms such as satellites, buoys, Argo floats, and ships.
Northeast US
Sea surface temperature is defined as the average temperature of the top few millimeters of the ocean. Sea surface temperature monitoring tells us how the ocean and atmosphere interact, as well as providing fundamental data on the global climate system
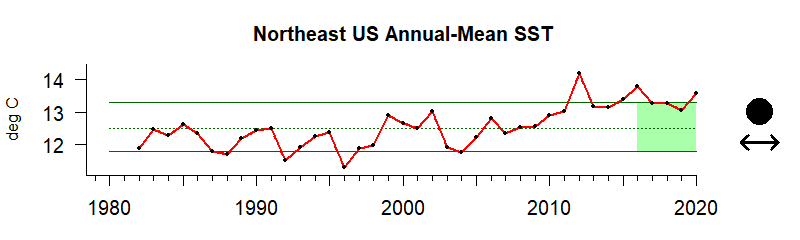
Description of time series:
The time series shows the integrated sea surface temperature for the Northeast US region. During the last five years there has been no notable trend and values have remained within the 10th and 90th percentiles of all observed data in the time series.
Description of gauge:
The gauge value of 90 indicates that the mean sea surface temperature between 2016 and 2020 for the Northeast US region was higher than 90% of the temperatures between 1982 and 2020.
Indicator and source information:
The SST data were accessed from (https://www.ncdc.noaa.gov/oisst). The data are plotted in degrees Celsius.
Data background and limitations:
To compensate for platform differences and sensor biases, satellite and ship observations are referenced to buoys. These data are NOAA 1/4° Daily Optimum Interpolation Sea Surface Temperature (version 2.1). Measurements of SST served through this portal incorporate data obtained from various platforms such as satellites, buoys, Argo floats, and ships.

Resources
IOOS and Bio-TT
The 34 IOOS Core Variables: Ocean observing measurements required to detect and predict changes in the ocean

Global Climate Indicators
The Global Climate Indicators are a set of parameters that describe the changing climate without reducing climate change to only temperature. They comprise key information for the most relevant domains of climate change: temperature and energy, atmospheric composition, ocean, and water as well as the cryosphere.

GOOS Essential Ocean Variables
The ocean environment is vast, remote, and harsh, and the cost involved in its observation are high. There is a need to avoid duplication of efforts, across observing platforms and networks, and to adopt common standards for data collection and dissemination to maximize the utility of data. To address these concerns, the Framework is designed to approach ocean observations with a focus on Essential Ocean Variables, ensuring assessments that cut across platforms and recommend the best, most cost effective plan to provide an optimal global view for each EOV.

Climate Change Indicators in the US (4th Edition)
EPA partners with more than 40 data contributors from various government agencies, academic institutions, and other organizations to compile a key set of indicators related to the causes and effects of climate change. The indicators are published in EPA's report, Climate Change Indicators in the United States, available on this website and in print. Explore the indicators below.

U.S. Global Change Research Program
Indicators are observations or calculations that can be used to track conditions and trends. Indicators related to climate—which may be physical, ecological, or societal—can be used to understand how environmental conditions are changing, assess risks and vulnerabilities, and help inform resiliency and planning for climate impacts.

Sea Surface Temperature - Map Viewer - Climate Prediction Center GIS Portal
NOAA Climate.gov provides science and information for a climate-smart nation. Americans’ health, security, and economic well-being are closely linked to climate and weather. People want and need information to help them make decisions on how to manage climate-related risks and opportunities they face.
NOAA Climate.gov is a source of timely and authoritative scientific data and information about climate. Our goals are to promote public understanding of climate science and climate-related events, to make our data products and services easy to access and use, to provide climate-related support to the private sector and the Nation’s economy, and to serve people making climate-related decisions with tools and resources that help them answer specific questions.

Sea Surface Temperature (SST) Contour Charts - Office of Satellite and Product Operations
The Office of Satellite and Product Operations (OSPO) manages and directs the operation of the central ground facilities which ingest, process, and distribute environmental satellite data and derived products to domestic and foreign users.
Sea Surface Temperature - NOAA CoastWatch
NOAA CoastWatch/OceanWatch provides easy access for everyone to global and regional satellite data products for use in understanding, managing and protecting ocean and coastal resources and for assessing impacts of environmental change in ecosystems, weather, and climate.

Marine/Ocean Data - NCEI
NCEI receives and archives meteorological data from ships at sea, moored and drifting buoys, coastal stations, rigs, and platforms. The temporal frequency of the observations range from sub-hourly to six-hourly synoptic and are global in spatial coverage.