
Description of Fishing Engagement:
Recreational and commercial fishing engagement is measured by the presence of fishing activity in coastal communities. The commercial engagement index is measured through permits, fish dealers, and vessel landings. The data for recreational engagement indicators varies by state. A high rank within these indicates more engagement in fisheries. For details on both data sources and indicator development, please see https://www.fisheries.noaa.gov/national/socioeconomics/social-indicators-fishing-communities-0.
NOAA Monitors recreational and commercial fishing engagement to better understand the social and economic impacts of fishing policies and regulations on our nation’s vital fishing communities. This and other social indicators help assess a coastal community’s resilience. NOAA works with state and local partners to monitor these indicators. We present data from the Northeast, Southeast, Gulf of Mexico, California Current, Alaska, and Pacific Island regions.
Data Source:
Recreational and Commercial fishing engagement data is from the National Marine Fisheries Service’s social indicator data portal: https://www.st.nmfs.noaa.gov/data-and-tools/social-indicators/ The percentage of all communities in each region classified as medium, medium high, or highly engaged is presented for both recreational and commercial fishing.
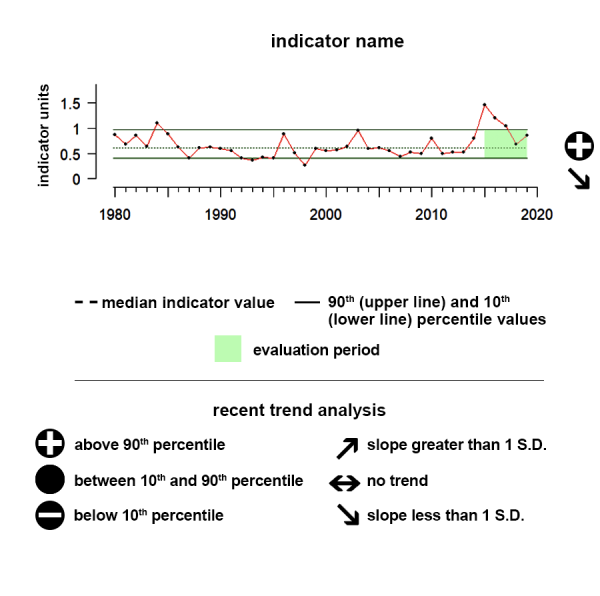
Understanding the Time series plots
Time series plots show the changes in each indicator as a function of time, over the period 1980-present. Each plot also shows horizontal lines that indicate the median (middle) value of that indicator, as well as the 10th and 90th percentiles, each calculated for the entire period of measurement. Time series plots were only developed for datasets with at least 10 years of data. Two symbols located to the right of each plot describe how recent values of an indicator compare against the overall series. A black circle indicates whether the indicator values over the last five years are on average above the series 90th percentile (plus sign), below the 10th percentile (minus sign), or between those two values (solid circle). Beneath that an arrow reflects the trend of the indicator over the last five years; an increase or decrease greater than one standard deviation is reflected in upward or downward arrows respectively, while a change of less than one standard deviation is recorded by a left-right arrow.
Alaska
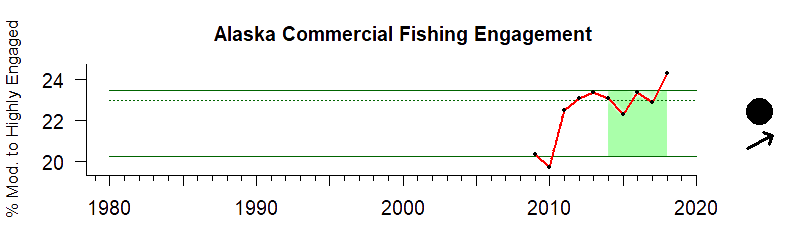
The x-axis on this time series represents years and the y-axis represents the percent of communities that are moderate to highly engaged in commercial fishing across Alaska. Commercial fishing engagement is measured by the number permits, fish dealers, and vessel landings across Alaska.
Description of time series:
This time series shows the percent of communities moderately or highly engaged in commercial fishing in Alaska from 2009 to 2018. Between 2013 and 2018 (highlighted in green) the percent of communities moderately or highly engaged in commercial fishing showed no significant trend.
Description of gauge:
The gauge value of 70 indicates that the average annual commercial fishing engagement between 2013 and 2018 for Alaska was higher than 70% of all years in the time series.
Extreme Gauge values:
A value of zero on the gauge means that the average percentage of communities engaged in commercial or recreational fishing over the last 5 years of data was below any annual engagement level up until that point, while a value of 100 would indicate the average over that same period was above any engagement level up until that point.
Data Source:
Commercial fishing engagement data is from the National Marine Fisheries Service’s social indicator data portal:https://www.st.nmfs.noaa.gov/data-and-tools/social-indicators/ The percentage of all communities in each region classified as medium, medium high, or highly engaged is presented for both recreational and commercial fishing.
Hawai'i
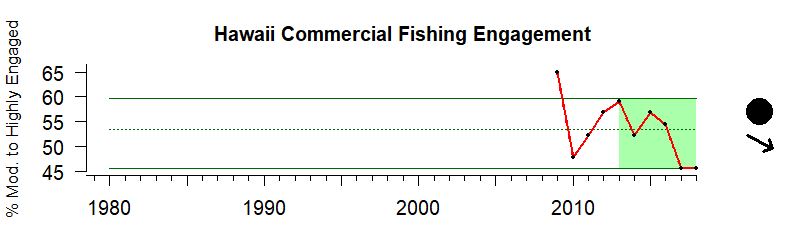
The x-axis on this time series represents years and the y-axis represents the percent of communities that are moderate to highly engaged in commercial fishing across Hawaiʻi. Commercial fishing engagement is measured by the number of permits, fish dealers, and vessel landings across Hawaiʻi.
Description of time series:
This time series shows the percent of communities moderately or highly engaged in commercial fishing in Hawaiʻi from 2009 to 2018. Between 2013 and 2018 (highlighted in green) the percent of communities moderately or highly engaged in commercial fishing showed a downward trend.
Description of gauge:
The gauge value of 30 indicates that the average annual commercial fishing engagement between 2013 and 2018 for Hawaiʻi was higher than 30% of all years in the time series.
Extreme Gauge values:
A value of zero on the gauge means that the average percentage of communities engaged in commercial or recreational fishing over the last 5 years of data was below any annual engagement level up until that point, while a value of 100 would indicate the average over that same period was above any engagement level up until that point.
Data Source:
Commercial fishing engagement data is from the National Marine Fisheries Service’s social indicator data portal:https://www.st.nmfs.noaa.gov/data-and-tools/social-indicators/ The percentage of all communities in each region classified as medium, medium high, or highly engaged is presented for both recreational and commercial fishing.
California Current
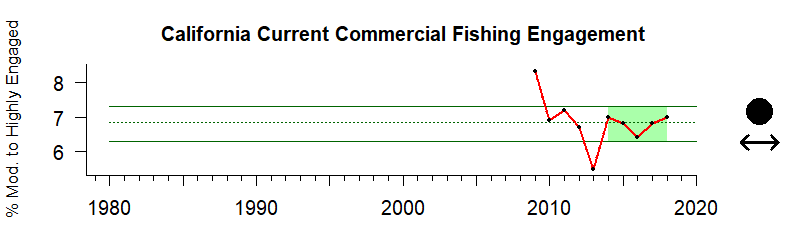
The x-axis on this time series represents years and the y-axis represents the percent of communities that are moderate to highly engaged in commercial fishing across California Current. Commercial fishing engagement is measured by the number permits, fish dealers, and vessel landings across California Current.
Description of time series:
This time series shows the percent of communities moderately or highly engaged in commercial fishing in California Current from 2009 to 2018. Between 2013 and 2018 the percent of communities moderately or highly engaged in commercial fishing showed no significant trend.
Description of gauge:
The gauge value of 50 indicates that the average annual commercial fishing engagement between 2013 and 2018 for California Current communities was higher than 50% of all years in the time series.
Extreme Gauge values:
A value of zero on the gauge means that the average percentage of communities engaged in commercial or recreational fishing over the last 5 years of data was below any annual engagement level up until that point, while a value of 100 would indicate the average over that same period was above any engagement level up until that point.
Data Source:
Commercial fishing engagement data is from the National Marine Fisheries Service’s social indicator data portal:https://www.st.nmfs.noaa.gov/data-and-tools/social-indicators/ The percentage of all communities in each region classified as medium, medium high, or highly engaged is presented for both recreational and commercial fishing.
Gulf of Mexico
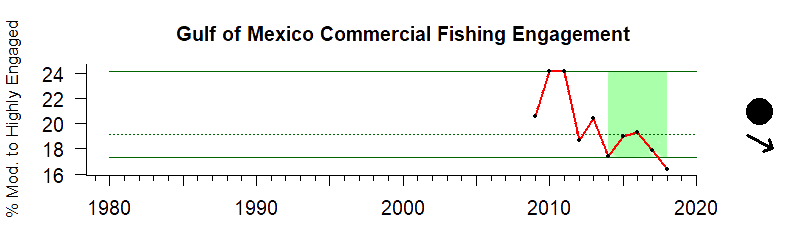
The x-axis on this time series represents years and the y-axis represents the percent of communities that are moderate to highly engaged in commercial fishing across the Gulf of Mexico. Commercial fishing engagement is measured by the number permits, fish dealers, and vessel landings across coastal communities in the Gulf of Mexico.
Description of time series:
This time series shows the percent of communities moderately or highly engaged in commercial fishing in the Gulf of Mexico from 2009 to 2018. Between 2013 and 2018 the percent of communities moderately or highly engaged in commercial fishing showed no trend.
Description of gauge:
The gauge value of 30 indicates that the mean annual commercial fishing engagement between 2013 and 2018 for Gulf of Mexico communities was higher than 30% of all years in the time series.
Extreme Gauge values:
A value of zero on the gauge means that the average percentage of communities engaged in commercial or recreational fishing over the last 5 years of data was below any annual engagement level up until that point, while a value of 100 would indicate the average over that same period was above any engagement level up until that point.
Data Source:
Commercial fishing engagement data is from the National Marine Fisheries Service’s social indicator data portal:https://www.st.nmfs.noaa.gov/data-and-tools/social-indicators/ The percentage of all communities in each region classified as medium, medium high, or highly engaged is presented for both recreational and commercial fishing.
Southeast US
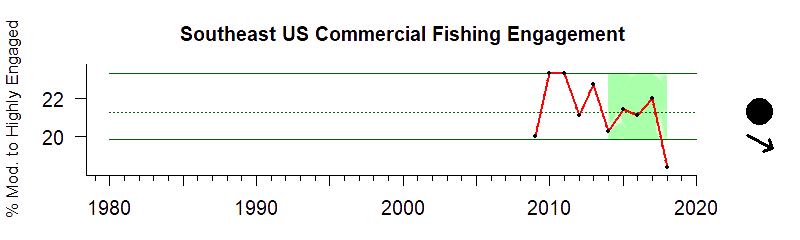
The x-axis on this time series represents years and the y-axis represents the percent of communities that are moderate to highly engaged in commercial fishing across the Southeast. Commercial fishing engagement is measured by the number permits, fish dealers, and vessel landings across coastal communities in the Southeast.
Description of time series:
This time series shows the percent of communities moderately or highly engaged in commercial fishing in Southeast from 2009 to 2018. Between 2013 and 2018 the percent of communities moderately or highly engaged in commercial fishing showed a downward trend.
Description of gauge:
The gauge value of 30 indicates that the average annual commercial fishing engagement between 2013 and 2018 for Southeast communities was higher than 30% of all years in the time series.
Extreme Gauge values:
A value of zero on the gauge means that the average percentage of communities engaged in commercial or recreational fishing over the last 5 years of data was below any annual engagement level up until that point, while a value of 100 would indicate the average over that same period was above any engagement level up until that point.
Data Source:
Commercial fishing engagement data is from the National Marine Fisheries Service’s social indicator data portal:https://www.st.nmfs.noaa.gov/data-and-tools/social-indicators/ The percentage of all communities in each region classified as medium, medium high, or highly engaged is presented for both recreational and commercial fishing.
Northeast US
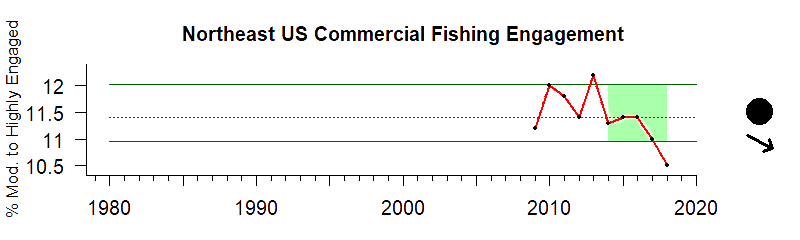
The x-axis on this time series represents years and the y-axis represents the percent of communities that are moderate to highly engaged in commercial fishing across Northeast. Commercial fishing engagement is measured by the number permits, fish dealers, and vessel landings across the Northeast.
Description of time series:
This time series shows the percent of communities moderately or highly engaged in commercial fishing in the Northeast from 2009 to 2018. Between 2013 and 2018 the percent of communities moderately or highly engaged in commercial fishing showed a downward trend.
Description of gauge:
The gauge value of 20 indicates that the mean annual commercial fishing engagement between 2013 and 2018 for Northeast communities was higher than 20% of all years in the time series.
Extreme Gauge values:
A value of zero on the gauge means that the average percentage of communities engaged in commercial or recreational fishing over the last 5 years of data was below any annual engagement level up until that point, while a value of 100 would indicate the average over that same period was above any engagement level up until that point.
Data Source:
Commercial fishing engagement data is from the National Marine Fisheries Service’s social indicator data portal:https://www.st.nmfs.noaa.gov/data-and-tools/social-indicators/ The percentage of all communities in each region classified as medium, medium high, or highly engaged is presented for both recreational and commercial fishing
Alaska
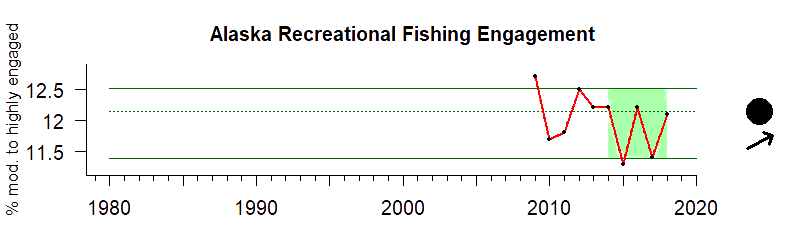
The x-axis on this time series represents years and the y-axis represents the percent of communities that are moderately to highly engaged in recreational fishing across Alaska.
Description of time series:
This time series shows the percent of communities moderately to highly engaged in recreational fishing in Alaska from 2009 to 2018. Between 2013 and 2018 (highlighted in green) the percent of communities moderately or highly engaged in recreational fishing showed an upward trend.
Description of gauge:
The gauge value of 40 indicates that the average annual recreational fishing engagement between 2013 and 2018 for Alaska was higher than 40% of all years between 2009 and 2018.
Extreme Gauge values:
A value of zero on the gauge means that the average percentage of communities engaged in commercial or recreational fishing over the last 5 years of data was below any annual engagement level up until that point, while a value of 100 would indicate the average over that same period was above any engagement level up until that point.
Indicator Source Information
The Alaska recreational engagement index is measured using the number of charter and sportfishing guide businesses, and sportfishing and guide licenses.
Data Source:
Commercial fishing engagement data is from the National Marine Fisheries Service’s social indicator data portal:https://www.st.nmfs.noaa.gov/data-and-tools/social-indicators/ The percentage of all communities in each region classified as medium, medium high, or highly engaged is presented for both recreational and commercial fishing
Hawai'i
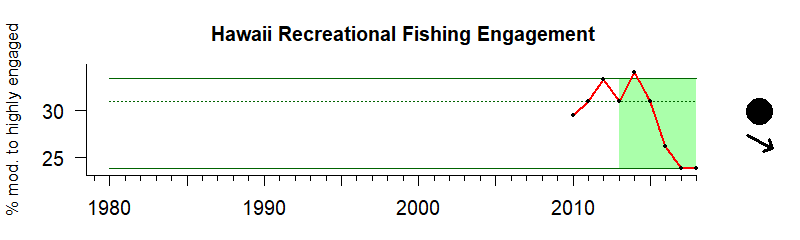
The x-axis on this time series represents years and the y-axis represents the percent of communities that are moderately to highly engaged in recreational fishing across Hawai’i.
Description of time series:
This time series shows the percent of communities moderately to highly engaged in recreational fishing in Hawai’i and the Pacific Islands from 2010 to 2018. Between 2013 and 2018 (highlighted in green) the percent of communities moderately or highly engaged in recreational fishing showed a downward trend.
Description of gauge:
The gauge value of 33 indicates that the average annual recreational fishing engagement between 2013 and 2018 for Hawai’i and the Pacific Islands was only higher than 33% of all years between 2010 and 2018
Extreme Gauge values:
A value of zero on the gauge means that the average percentage of communities engaged in commercial or recreational fishing over the last 5 years of data was below any annual engagement level up until that point, while a value of 100 would indicate the average over that same period was above any engagement level up until that point.
Indicator Source Information:
The Hawai'i recreational engagement index is measured using the number of trips for charter, private recreational, shore and all modes combined.
Data Source:
Commercial fishing engagement data is from the National Marine Fisheries Service’s social indicator data portal:https://www.st.nmfs.noaa.gov/data-and-tools/social-indicators/ The percentage of all communities in each region classified as medium, medium high, or highly engaged is presented for both recreational and commercial fishing
Gulf of Mexico
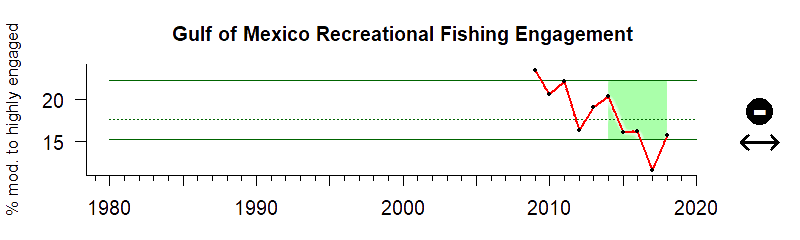
The x-axis on this time series represents years and the y-axis represents the percent of communities that are moderately to highly engaged in recreational fishing across the Gulf of Mexico.
Description of time series:
This time series shows the percent of communities moderately to highly engaged in recreational fishing in the Gulf of Mexico from 2009 to 2018. Between 2013 and 2018 (highlighted in green) the percent of communities moderately or highly engaged in recreational fishing showed no significant trend.
Description of gauge:
The gauge value of 20 indicates that the average annual recreational fishing engagement between 2013 and 2018 for the Gulf of Mexico was only higher than 20% of all years between 2009 and 2018
Extreme Gauge values:
A value of zero on the gauge means that the average percentage of communities engaged in commercial or recreational fishing over the last 5 years of data was below any annual engagement level up until that point, while a value of 100 would indicate the average over that same period was above any engagement level up until that point.
Indicator Source Information:
The Gulf of Mexico recreational engagement index is measured using shore, private vessel and for-hire vessel fishing activity estimates for western Florida to Mississippi. The index for Louisiana and Texas is measured using estimates for boat ramps, fishing piers, recreational vessels by homeport and recreational vessels by owner address.
Data Source:
Commercial fishing engagement data is from the National Marine Fisheries Service’s social indicator data portal:https://www.st.nmfs.noaa.gov/data-and-tools/social-indicators/ The percentage of all communities in each region classified as medium, medium high, or highly engaged is presented for both recreational and commercial fishing
Southeast US
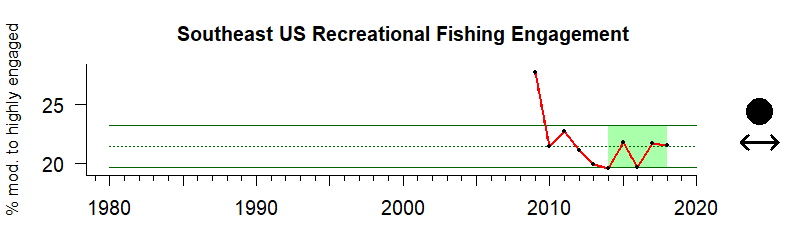
The x-axis on this time series represents years and the y-axis represents the percent of communities that are moderately to highly engaged in recreational fishing across the Southeast US.
Description of time series:
This time series shows the percent of communities moderately to highly engaged in recreational fishing in the Southeast US from 2009 to 2018. Between 2013 and 2018 (highlighted in green) the percent of communities moderately or highly engaged in recreational fishing showed no significant trend
Description of gauge:
The gauge value of 30 indicates that the average annual recreational fishing engagement between 2013 and 2018 for the Southeast US was only higher than 30% of all years between 2009 and 2018
Extreme Gauge values:
A value of zero on the gauge means that the average percentage of communities engaged in commercial or recreational fishing over the last 5 years of data was below any annual engagement level up until that point, while a value of 100 would indicate the average over that same period was above any engagement level up until that point.
Indicator Source Information:
The Southeast recreational engagement index is measured using shore, private vessel and for-hire vessel fishing activity estimates.
Data Source:
Commercial fishing engagement data is from the National Marine Fisheries Service’s social indicator data portal:https://www.st.nmfs.noaa.gov/data-and-tools/social-indicators/ The percentage of all communities in each region classified as medium, medium high, or highly engaged is presented for both recreational and commercial fishing
Northeast US
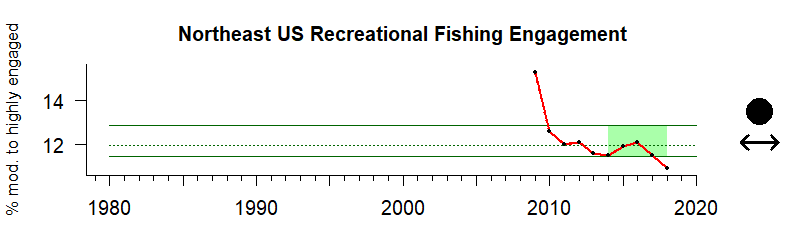
The x-axis on this time series represents years and the y-axis represents the percent of communities that are moderately to highly engaged in recreational fishing across the Northeast
Description of time series:
This time series shows the percent of communities moderately to highly engaged in recreational fishing in the Northeast US from 2009 to 2018. Between 2013 and 2018 (highlighted in green) the percent of communities moderately or highly engaged in recreational fishing showed no significant trend.
Description of gauge:
The gauge value of 30 indicates that the average annual recreational fishing engagement between 2013 and 2018 for the Northeast US was only higher than 30% of all years between 2009 and 2018
Extreme Gauge values:
A value of zero on the gauge means that the average percentage of communities engaged in commercial or recreational fishing over the last 5 years of data was below any annual engagement level up until that point, while a value of 100 would indicate the average over that same period was above any engagement level up until that point.
Indicator Source Information:
The Northeast recreational engagement indicator is measured using shore, private vessel and for-hire vessel fishing activity estimates.
Data Source:
Commercial fishing engagement data is from the National Marine Fisheries Service’s social indicator data portal:https://www.st.nmfs.noaa.gov/data-and-tools/social-indicators/ The percentage of all communities in each region classified as medium, medium high, or highly engaged is presented for both recreational and commercial fishing

Resources
National Marine Fisheries Service Social Indicators
Social indicators are numerical measures that describe the well-being of individuals or communities. Indicators are comprised of one variable or several components combined into an index. They are used to describe and evaluate community well-being in terms of social, economic, and psychological welfare.

Fishing Community Profiles
Engagement in fisheries and information on the social and economic characteristics of these communities.

NOAA Economic National Ocean Watch data base
The Economics: National Ocean Watch (ENOW) data set features time-series data focused on the six economic sectors that are dependent on the oceans and Great Lakes. ENOW is available for counties, states, regions, and the nation in a wide variety of formats.