Description of beach closures:
The beach closure indicator is the number of days a beach is closed, because the water and/or air quality is determined to be unsafe. Unsafe water and air quality may have significant impacts on human health, local economies, and ecosystems.
Data source(s):
The information presented is from states, counties, and tribes that submit data to the EPA Beach Program reporting database. Not all US beach closures are captured in this database. We present here a summary of known EPA Beach Program closure days by year for Alaska, California Current, Gulf of Mexico, Northeast, Hawaiian Islands, and the Southeast regions.
Data obtained from the EPA BEACON website have been provided to EPA by the coastal and Great Lakes states, tribes and territories that receive grants under the BEACH Act.
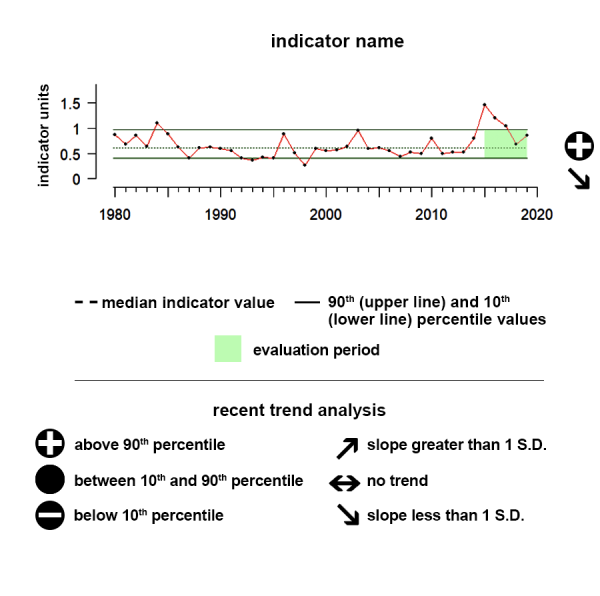
Understanding the Time series plots
Time series plots show the changes in each indicator as a function of time, over the period 1980-present. Each plot also shows horizontal lines that indicate the median (middle) value of that indicator, as well as the 10th and 90th percentiles, each calculated for the entire period of measurement. Time series plots were only developed for datasets with at least 10 years of data. Two symbols located to the right of each plot describe how recent values of an indicator compare against the overall series. A black circle indicates whether the indicator values over the last five years are on average above the series 90th percentile (plus sign), below the 10th percentile (minus sign), or between those two values (solid circle). Beneath that an arrow reflects the trend of the indicator over the last five years; an increase or decrease greater than one standard deviation is reflected in upward or downward arrows respectively, while a change of less than one standard deviation is recorded by a left-right arrow.
Hawai'i - Pacific Islands
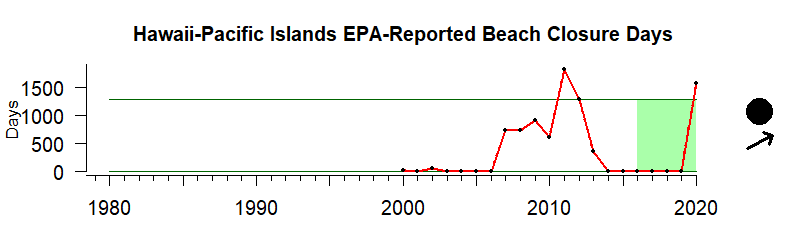
NOTE: The previous graph on this page contained a data error that overestimated the number of beach closures for this region. This error has been addressed as of August 2021.
Beach closures are the number of days when beach water quality is determined to be unsafe.
Data Interpretation:
Time series: This time series shows the average number of beach closure days in the Hawai‘i–Pacific Islands region from 2000 to 2020. During the last five years there has been a significant upward trend while values have remained within the 10th and 90th percentiles of all observed data in the time series.
Gauge: The gauge value of 62 indicates that between 2016 and 2020 the average number of beach closure days in the Hawai‘i–Pacific Islands region was higher than the median value of beach closure days between 2000 and 2020 which was 0.
Gauge values
0–10: The five-year beach closure days average is very low compared to the median value.
10–25: The five-year beach closure days average is much lower than the median value.
25–50: The five-year beach closure days average is lower than the median value.
50: The five-year beach closure days average equals the median value.
50–75: The five-year beach closure days average is higher than the median value.
75–90: The five-year beach closure days average is much higher than the median value.
90–100: The five-year beach closure days average is very high compared to the median.
* gauge value is the percentile rank of the last five years based on the time series.
Indicator and source information:
Unsafe water quality may have significant impacts on human health, local economies, and the ecosystem. Beach water quality is determined by the concentration of bacteria in the water (either Enterococcus sp. or Escherichia coli).
The US Environmental Protection Agency (EPA) supports coastal states, counties and tribes in monitoring beach water quality, and notifying the public when beaches must be closed. The information presented is from states, counties, and tribes that submit data to the EPA Beach Program reporting database (BEACON). Data obtained from the EPA BEACON website have been provided to EPA by the coastal and Great Lakes states, tribes and territories that receive grants under the BEACH Act. Data were refined to closure, by state or territory, by year.
Data background and limitations:
Data compiled by states or territories are combined in regions defined as US Large Marine Ecosystems (LME). Changes in the number of beach closure days may be driven by changes in the number of beaches monitored under the BEACH Act versus by state and local municipalities and not by changes in water and/or air quality. Not all US beach closures are captured in this database, because not all beaches in a state or territory are monitored through the EPA BEACH Act. Data that were not identified to a water body or identified as inland water were not included. Data for beaches monitored by state and local municipalities are not included.
California Current
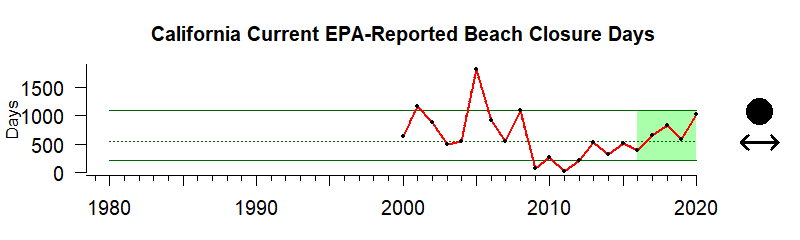
Beach closures are the number of days when beach water quality is determined to be unsafe.
Data Interpretation:
Time series: This time series shows the average number of beach closure days in the California Current region from 2000 to 2020. During the last five years there has been a significant upward trend while values have remained within the 10th and 90th percentiles of all observed data in the time series. showed a significant upward trend.
Gauge: The gauge value of 67 indicates that between 2016 and 2020 the average number of beach closure days in the California Current region was higher than the median value of beach closure days between 2000 and 2020 which was 555.
Indicator and source information:
Unsafe water quality may have significant impacts on human health, local economies, and the ecosystem. Beach water quality is determined by the concentration of bacteria in the water (either Enterococcus sp. or Escherichia coli).
The US Environmental Protection Agency (EPA) supports coastal states, counties and tribes in monitoring beach water quality, and notifying the public when beaches must be closed. The information presented is from states, counties, and tribes that submit data to the EPA Beach Program reporting database (BEACON). Data obtained from the EPA BEACON website have been provided to EPA by the coastal and Great Lakes states, tribes and territories that receive grants under the BEACH Act. Data were refined to closure, by state or territory, by year.
Data background and limitations:
Data compiled by states or territories are combined in regions defined as US Large Marine Ecosystems (LME). Changes in the number of beach closure days may be driven by changes in the number of beaches monitored under the BEACH Act versus by state and local municipalities and not by changes in water and/or air quality. Not all US beach closures are captured in this database, because not all beaches in a state or territory are monitored through the EPA BEACH Act. Data that were not identified to a water body or identified as inland water were not included. Data for beaches monitored by state and local municipalities are not included.
Gulf of Mexico
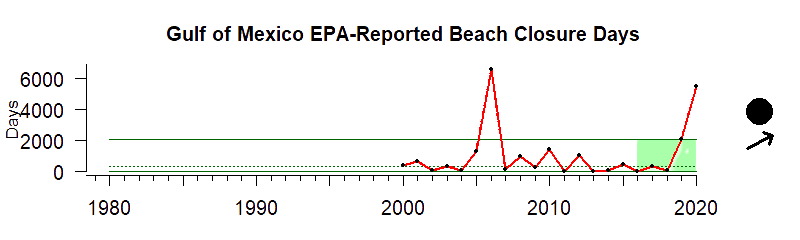
Beach closures are the number of days when beach water quality is determined to be unsafe.
Data Interpretation:
Time series: This time series shows the average number of beach closure days in the Gulf of Mexico region from 2000 to 2020. During the last five years there has been a significant upward trend while values have remained within the 10th and 90th percentiles of all observed data in the time series.
Gauge: The gauge value of 86 indicates that between 2016 and 2020 the average number of beach closure days in the Gulf of Mexico region was much higher than the median value of beach closure days between 2000 and 2020 which was 326.
Indicator and source information:
Unsafe water quality may have significant impacts on human health, local economies, and the ecosystem. Beach water quality is determined by the concentration of bacteria in the water (either Enterococcus sp. or Escherichia coli).
The US Environmental Protection Agency (EPA) supports coastal states, counties and tribes in monitoring beach water quality, and notifying the public when beaches must be closed. The information presented is from states, counties, and tribes that submit data to the EPA Beach Program reporting database (BEACON). Data obtained from the EPA BEACON website have been provided to EPA by the coastal and Great Lakes states, tribes and territories that receive grants under the BEACH Act. Data were refined to closure, by state or territory, by year.
Data background and limitations:
Data compiled by states or territories are combined in regions defined as US Large Marine Ecosystems (LME). Changes in the number of beach closure days may be driven by changes in the number of beaches monitored under the BEACH Act versus by state and local municipalities and not by changes in water and/or air quality. Not all US beach closures are captured in this database, because not all beaches in a state or territory are monitored through the EPA BEACH Act. Data that were not identified to a water body or identified as inland water were not included. Data for beaches monitored by state and local municipalities are not included.
Northeast US
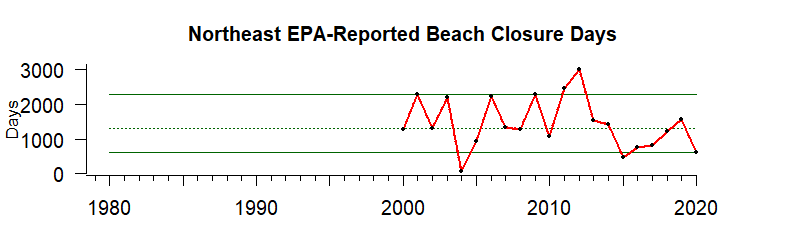
Beach closures are the number of days when beach water quality is determined to be unsafe.
Data Interpretation:
Time series: This time series shows the average number of beach closure days in the Northeast US region from 2000 to 2020. During the last five years there has been no notable trend and values have remained within the 10th and 90th percentiles of all observed data in the time series.
Gauge: The gauge value of 29 indicates that between 2016 and 2020 the average number of beach closure days in the Northeast US region was lower than the median value of beach closure days between 2000 and 2020 which was 1,311.
Gauge values
0–10: The five-year beach closure days average is very low compared to the median value.
10–25: The five-year beach closure days average is much lower than the median value.
25–50: The five-year beach closure days average is lower than the median value.
50: The five-year beach closure days average equals the median value.
50–75: The five-year beach closure days average is higher than the median value.
75–90: The five-year beach closure days average is much higher than the median value.
90–100: The five-year beach closure days average is very high compared to the median.
* gauge value is the percentile rank of the last five years based on the time series.
Indicator and source information:
Unsafe water quality may have significant impacts on human health, local economies, and the ecosystem. Beach water quality is determined by the concentration of bacteria in the water (either Enterococcus sp. or Escherichia coli).
The US Environmental Protection Agency (EPA) supports coastal states, counties and tribes in monitoring beach water quality, and notifying the public when beaches must be closed. The information presented is from states, counties, and tribes that submit data to the EPA Beach Program reporting database (BEACON). Data obtained from the EPA BEACON website have been provided to EPA by the coastal and Great Lakes states, tribes and territories that receive grants under the BEACH Act. Data were refined to closure, by state or territory, by year.
Data background and limitations:
Data compiled by states or territories are combined in regions defined as US Large Marine Ecosystems (LME). Changes in the number of beach closure days may be driven by changes in the number of beaches monitored under the BEACH Act versus by state and local municipalities and not by changes in water and/or air quality. Not all US beach closures are captured in this database, because not all beaches in a state or territory are monitored through the EPA BEACH Act. Data that were not identified to a water body or identified as inland water were not included. Data for beaches monitored by state and local municipalities are not included.
Alaska
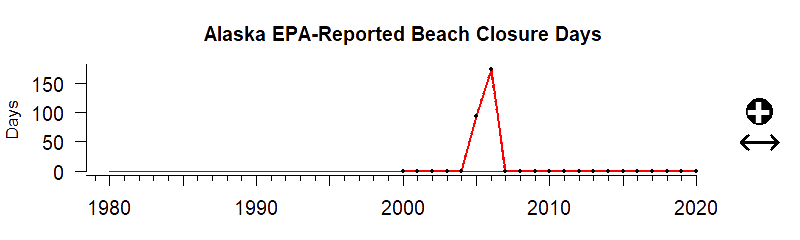
Beach closures are the number of days when beach water quality is determined to be unsafe.
Data Interpretation:
Time series: This time series shows the average number of beach closure days for the Alaska region from 2000 to 2020. During the last five years there has been no notable trend but values were above the 90th percentile of all observed data in the time series.
Gauge: A gauge was not appropriate for this data due to data limitations.
Gauge values
0–10: The five-year beach closure days average is very low compared to the median value.
10–25: The five-year beach closure days average is much lower than the median value.
25–50: The five-year beach closure days average is lower than the median value.
50: The five-year beach closure days average equals the median value.
50–75: The five-year beach closure days average is higher than the median value.
75–90: The five-year beach closure days average is much higher than the median value.
90–100: The five-year beach closure days average is very high compared to the median.
* gauge value is the percentile rank of the last five years based on the time series.
Indicator and source information:
Unsafe water quality may have significant impacts on human health, local economies, and the ecosystem. Beach water quality is determined by the concentration of bacteria in the water (either Enterococcus sp. or Escherichia coli).
The US Environmental Protection Agency (EPA) supports coastal states, counties and tribes in monitoring beach water quality, and notifying the public when beaches must be closed. The information presented is from states, counties, and tribes that submit data to the EPA Beach Program reporting database (BEACON). Data obtained from the EPA BEACON website have been provided to EPA by the coastal and Great Lakes states, tribes and territories that receive grants under the BEACH Act. Data were refined to closure, by state or territory, by year.
Data background and limitations:
Data compiled by states or territories are combined in regions defined as US Large Marine Ecosystems (LME). Changes in the number of beach closure days may be driven by changes in the number of beaches monitored under the BEACH Act versus by state and local municipalities and not by changes in water and/or air quality. Not all US beach closures are captured in this database, because not all beaches in a state or territory are monitored through the EPA BEACH Act. Data that were not identified to a water body or identified as inland water were not included. Data for beaches monitored by state and local municipalities are not included.
Caribbean
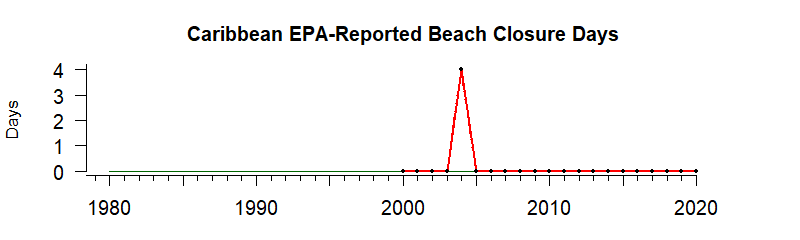
Beach closures are the number of days when beach water quality is determined to be unsafe.
Data Interpretation:
Time series: This time series shows the average number of beach closure days in the Caribbean region from 2000 to 2020. During the last five years there has been no notable trend but values were above the 90th percentile of all observed data in the time series.
Gauge: A gauge was not appropriate for this data due to data limitations.
Gauge values
0–10: The five-year beach closure days average is very low compared to the median value.
10–25: The five-year beach closure days average is much lower than the median value.
25–50: The five-year beach closure days average is lower than the median value.
50: The five-year beach closure days average equals the median value.
50–75: The five-year beach closure days average is higher than the median value.
75–90: The five-year beach closure days average is much higher than the median value.
90–100: The five-year beach closure days average is very high compared to the median.
* gauge value is the percentile rank of the last five years based on the time series.
Indicator and source information:
Unsafe water quality may have significant impacts on human health, local economies, and the ecosystem. Beach water quality is determined by the concentration of bacteria in the water (either Enterococcus sp. or Escherichia coli).
The US Environmental Protection Agency (EPA) supports coastal states, counties and tribes in monitoring beach water quality, and notifying the public when beaches must be closed. The information presented is from states, counties, and tribes that submit data to the EPA Beach Program reporting database (BEACON). Data obtained from the EPA BEACON website have been provided to EPA by the coastal and Great Lakes states, tribes and territories that receive grants under the BEACH Act. Data were refined to closure, by state or territory, by year.
Data background and limitations:
Data compiled by states or territories are combined in regions defined as US Large Marine Ecosystems (LME). Changes in the number of beach closure days may be driven by changes in the number of beaches monitored under the BEACH Act versus by state and local municipalities and not by changes in water and/or air quality. Not all US beach closures are captured in this database, because not all beaches in a state or territory are monitored through the EPA BEACH Act. Data that were not identified to a water body or identified as inland water were not included. Data for beaches monitored by state and local municipalities are not included.
Southeast US
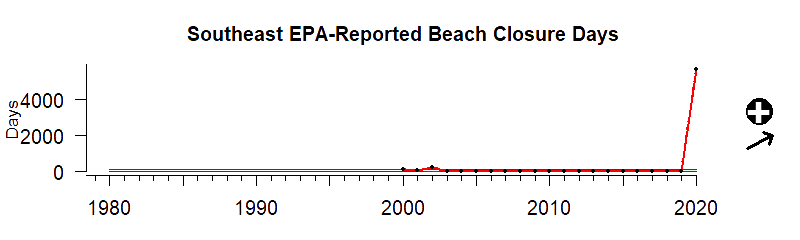
Beach closures are the number of days when beach water quality is determined to be unsafe.
Data Interpretation:
Time series: This time series shows the average number of beach closure days in the Southeast US region from 2000 to 2020. During the last five years there has been a significant upward trend and values were above the 90th percentile of all observed data in the time series.
Gauge: The gauge value of 95 indicates that between 2016 and 2020 the average number of beach closure days in the Southeast US region was very high compared to the median value of beach closure days between 2000 and 2020 which was 0.
Gauge values
0–10: The five-year beach closure days average is very low compared to the median value.
10–25: The five-year beach closure days average is much lower than the median value.
25–50: The five-year beach closure days average is lower than the median value.
50: The five-year beach closure days average equals the median value.
50–75: The five-year beach closure days average is higher than the median value.
75–90: The five-year beach closure days average is much higher than the median value.
90–100: The five-year beach closure days average is very high compared to the median.
* gauge value is the percentile rank of the last five years based on the time series.
Indicator and source information:
Unsafe water quality may have significant impacts on human health, local economies, and the ecosystem. Beach water quality is determined by the concentration of bacteria in the water (either Enterococcus sp. or Escherichia coli).
The US Environmental Protection Agency (EPA) supports coastal states, counties and tribes in monitoring beach water quality, and notifying the public when beaches must be closed. The information presented is from states, counties, and tribes that submit data to the EPA Beach Program reporting database (BEACON). Data obtained from the EPA BEACON website have been provided to EPA by the coastal and Great Lakes states, tribes and territories that receive grants under the BEACH Act. Data were refined to closure, by state or territory, by year.
Data background and limitations:
Data compiled by states or territories are combined in regions defined as US Large Marine Ecosystems (LME). Changes in the number of beach closure days may be driven by changes in the number of beaches monitored under the BEACH Act versus by state and local municipalities and not by changes in water and/or air quality. Not all US beach closures are captured in this database, because not all beaches in a state or territory are monitored through the EPA BEACH Act. Data that were not identified to a water body or identified as inland water were not included. Data for beaches monitored by state and local municipalities are not included.

Resources
Beach Advisory and Closing On-line Notification
WATERS exposes several mapping services that provide access to numerous datasets. This web page describes the content and purpose of each mapping service.

Beach Water Quality Monitoring Programs in Coastal States
The Surfrider Foundation has assembled key information on beach water quality monitoring programs across the nation. Browse the state index below to see if current water quality information is available for your favorite beach.

NOAA Pathogen Forecast
An assortment of predictive models and weather related tools have been assembled, primarily related to issues surrounding safe harvest of shellfish around the nation. In partnership with the US Food and Drug Administration (USFDA), state and academic partners, NOAA is working continuously through the Ecological Forecasting Roadmap to verify and improve model accuracy and resolution, and transition them to a state of operations.

NCCOS Harmful Algal Bloom Forecasting
Our HAB forecasts alert coastal managers to blooms before they cause serious damage. Short-term (once or twice weekly) forecasts identify which blooms are potentially harmful, where they are, how big they are, and where they're likely headed. Longer-term, seasonal forecasts predict the severity of HABs for the bloom season in a particular region. Early warning provides health officials, environmental managers and water treatment facility operators information to focus their testing to guide beach and shellfish bed closures or water treatment in a more appropriate timeframe. They also allow the seafood and tourism industries to minimize impacts.