
Description of coastal employment:
The total coastal employment is the number of jobs in coastal communities. Businesses in coastal counties employ tens of millions of people nationally. This includes hundreds of thousands of ocean-dependent businesses that pay over $100 billion in wages annually. Many coastal and ocean amenities attracting visitors are free, generating no direct employment, wages, or gross domestic product. However, these “nonmarket” features are key drivers for many coastal businesses. We present data for all regions.
Data Source:
Coastal employment numbers were downloaded from the U.S. Bureau of Labor Statistics’ quarterly census of employment and wages, filtered to present only coastal county values using the Census Bureau’s list of coastal counties within each state. Of note is that these data fail to include self-employed individuals. Coastal county employment numbers were then summed within each region for reporting purposes. The 2021 Data update will occur in November 2021 - this indicator will be updated as soon as possible after.
Understanding the Time series plots
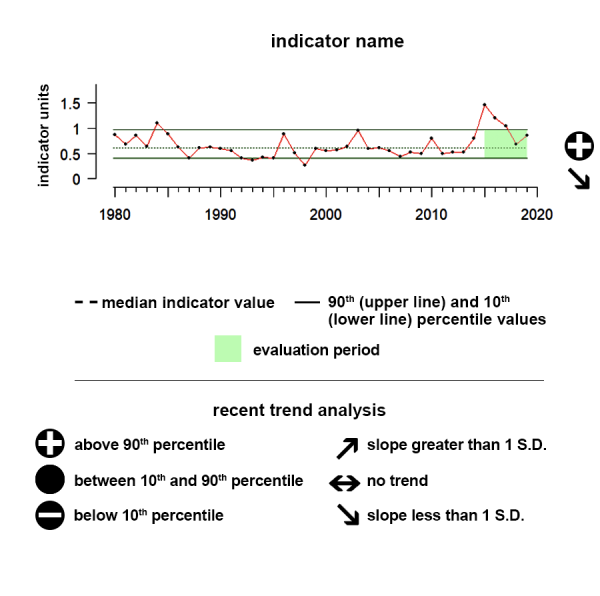
Time series plots show the changes in each indicator as a function of time, over the period 1980-present. Each plot also shows horizontal lines that indicate the median (middle) value of that indicator, as well as the 10th and 90th percentiles, each calculated for the entire period of measurement. Time series plots were only developed for datasets with at least 10 years of data. Two symbols located to the right of each plot describe how recent values of an indicator compare against the overall series. A black circle indicates whether the indicator values over the last five years are on average above the series 90th percentile (plus sign), below the 10th percentile (minus sign), or between those two values (solid circle). Beneath that an arrow reflects the trend of the indicator over the last five years; an increase or decrease greater than one standard deviation is reflected in upward or downward arrows respectively, while a change of less than one standard deviation is recorded by a left-right arrow.
Alaska
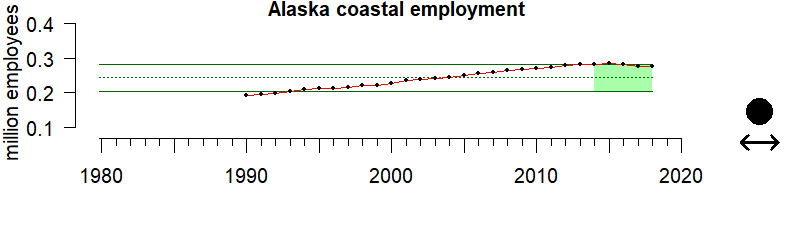
Values correspond to total employment in all industries in a given region
Description of time series:
Alaska’s coastal employment has been relatively steady between 2014 - 2018, with no clear trend and no substantial difference from historical patterns.
Description of gauge:
The gauge value of 85 indicates that coastal employment between 2014 and 2018 for Alaska was higher than 85% of all years between 1990 and 2018.
Extreme Gauge values:
A value of zero on the gauge means that the average coastal employment level over the last 5 years of data was below any annual employment level up until that point, while a value of 100 would indicate the average over that same period was above any annual employment level up until that point.
Data Source:
Coastal employment numbers were downloaded from the U.S. Bureau of Labor Statistics’ quarterly census of employment and wages, filtered to present only coastal county values using the Census Bureau’s list of coastal counties within each state. Of note is that these data fail to include self-employed individuals. Coastal county employment numbers were then summed within each region for reporting purposes.
Hawaiʻi-Pacific Islands
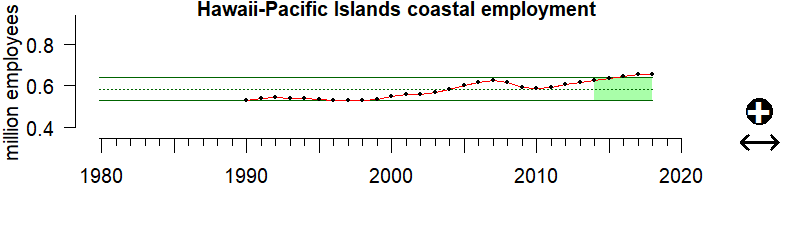
Values correspond to total employment in all industries in a given region
Description of time series:
Hawaiʻi’s average coastal employment between 2014 and 2018 was substantially above historical levels, although no trend is apparent over that same period.
Description of gauge:
The gauge value of 90 indicates that coastal employment between 2014 and 2018 for Hawaii and the Pacific Islands was higher than 90% of all years between 1990 and 2018.
Extreme Gauge values:
A value of zero on the gauge means that the average coastal employment level over the last 5 years of data was below any annual employment level up until that point, while a value of 100 would indicate the average over that same period was above any annual employment level up until that point.
Data Source :
Coastal employment numbers were downloaded from the U.S. Bureau of Labor Statistics’ quarterly census of employment and wages, filtered to present only coastal county values using the Census Bureau’s list of coastal counties within each state. Of note is that these data fail to include self-employed individuals. Coastal county employment numbers were then summed within each region for reporting purposes.
California Current
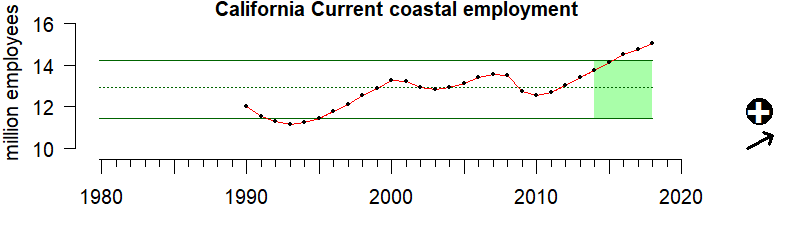
Values correspond to total employment in all industries in a given region
Description of time series:
Average coastal employment in the California Current ecosystem between 2014 and 2018 was substantially above historical levels, with an increasing trend over that period.
Description of gauge:
The gauge value of 90 indicates that coastal employment between 2014 and 2018 for the California Current was higher than 90% of all years between 1990 and 2018.
Extreme Gauge values:
A value of zero on the gauge means that the average coastal employment level over the last 5 years of data was below any annual employment level up until that point, while a value of 100 would indicate the average over that same period was above any annual employment level up until that point.
Data Source:
Coastal employment numbers were downloaded from the U.S. Bureau of Labor Statistics’ quarterly census of employment and wages, filtered to present only coastal county values using the Census Bureau’s list of coastal counties within each state. Of note is that these data fail to include self-employed individuals. Coastal county employment numbers were then summed within each region for reporting purposes.
Gulf of Mexico
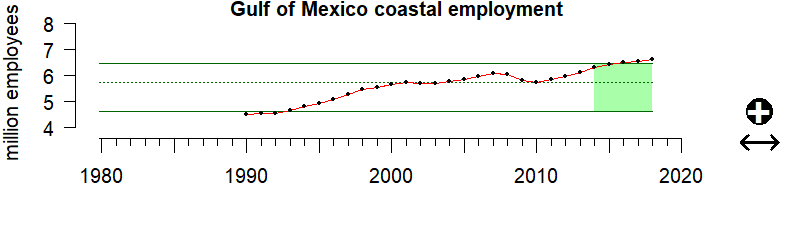
Values correspond to total employment in all industries in a given region
Description of time series:
Average coastal employment along the Gulf of Mexico between 2014 and 2018 was substantially above historical levels, although no trend is apparent over that same period.
Description of gauge:
The gauge value of 90 indicates that coastal employment between 2014 and 2018 for the Gulf of Mexico was higher than 90% of all years between 1990 and 2018.
Extreme Gauge values:
A value of zero on the gauge means that the average coastal employment level over the last 5 years of data was below any annual employment level up until that point, while a value of 100 would indicate the average over that same period was above any annual employment level up until that point.
Data Source:
Coastal employment numbers were downloaded from the U.S. Bureau of Labor Statistics’ quarterly census of employment and wages, filtered to present only coastal county values using the Census Bureau’s list of coastal counties within each state. Of note is that these data fail to include self-employed individuals. Coastal county employment numbers were then summed within each region for reporting purposes.
Caribbean
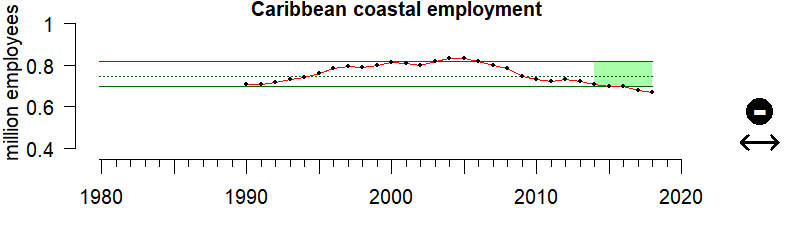
Values correspond to total employment in all industries in a given region
Description of time series:
Average coastal employment within the U.S. Caribbean between 2014 and 2018 was substantially below historical levels, with a decreasing trend over that period.
Description of gauge:
The gauge value of 6 indicates that coastal employment between 2014 and 2018 for the US Caribbean was higher than only 6% of all years between 1990 and 2018.
Extreme Gauge values:
A value of zero on the gauge means that the average coastal employment level over the last 5 years of data was below any annual employment level up until that point, while a value of 100 would indicate the average over that same period was above any annual employment level up until that point.
Data Source:
Coastal employment numbers were downloaded from the U.S. Bureau of Labor Statistics’ quarterly census of employment and wages, filtered to present only coastal county values using the Census Bureau’s list of coastal counties within each state. Of note is that these data fail to include self-employed individuals. Coastal county employment numbers were then summed within each region for reporting purposes.
Southeast
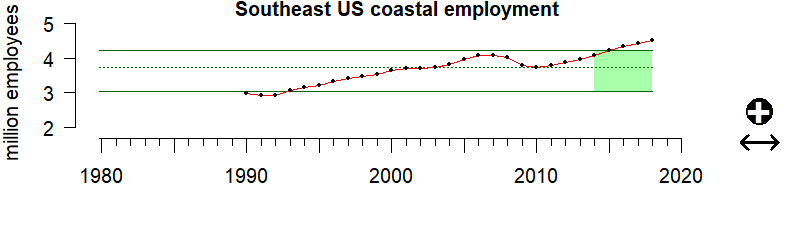
Values correspond to total employment in all industries in a given region
Description of time series:
Average coastal employment within the Southeast between 2014 and 2018 was substantially above historical levels, although no trend is apparent over that same period.
Description of gauge:
The gauge value of 90 indicates that coastal employment between 2014 and 2018 for the Southeast US was higher than 90% of all years between 1990 and 2018.
Extreme Gauge values:
A value of zero on the gauge means that the average coastal employment level over the last 5 years of data was below any annual employment level up until that point, while a value of 100 would indicate the average over that same period was above any annual employment level up until that point.
Data Source:
Coastal employment numbers were downloaded from the U.S. Bureau of Labor Statistics’ quarterly census of employment and wages, filtered to present only coastal county values using the Census Bureau’s list of coastal counties within each state. Of note is that these data fail to include self-employed individuals. Coastal county employment numbers were then summed within each region for reporting purposes.
Northeast
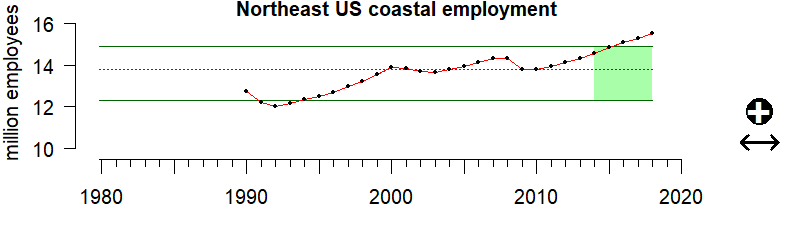
Values correspond to total employment in all industries in a given region
Description of time series:
Average coastal employment within the Northeast between 2014 and 2018 was substantially above historical levels, although no trend is apparent over that same period.
Description of gauge:
The gauge value of 90 indicates that coastal employment between 2014 and 2018 for the Northeast US was higher than 90% of all years between 1990 and 2018.
Extreme Gauge values:
A value of zero on the gauge means that the average coastal employment level over the last 5 years of data was below any annual employment level up until that point, while a value of 100 would indicate the average over that same period was above any annual employment level up until that point.
Data Source:
Coastal employment numbers were downloaded from the U.S. Bureau of Labor Statistics’ quarterly census of employment and wages, filtered to present only coastal county values using the Census Bureau’s list of coastal counties within each state. Of note is that these data fail to include self-employed individuals. Coastal county employment numbers were then summed within each region for reporting purposes.

Resources
Socio-Cultural Dimensions
We conduct research to better understand the impacts of management decisions on our nation’s vital fishing communities. Each region creates fishing community profiles, which contain social and economic data. Social indicators are used to help assess community resilience and vulnerability.

Social Indicators Map
NOAA Fisheries developed social indicators to characterize community well-being for coastal communities engaged in fishing activities.

NOAA Economic National Ocean Watch data base
This report examines the critically important economic contributions of the oceans and Great Lakes. The report presents the NOAA Office for Coastal Management’s Economics: National Ocean Watch (ENOW) data set, and includes a variety of infographics at the national, regional, and state levels.

Economics: National Ocean Watch (ENOW) for Self-Employed Workers
This data set describes the self-employed workers whose jobs directly depend on the resources of the oceans and Great Lakes. Data are derived from Census Nonemployer Statistics and include the number of self-employed workers and gross receipts for the six sectors defined by ENOW. These time-series data are available at the national, regional, state, and county levels.