
Description of Chlorophyll a:
Phytoplankton are microscopic plants at the base of most marine food webs and produce nearly half of the Earth’s oxygen. One way we estimate the number of phytoplankton in the ocean is by measuring the amount of chlorophyll a in the water. Chlorophyll a is a green pigment (the same pigment that makes tree leaves appear green) that the phytoplankton use to absorb sunlight. The amount (or concentration) of chlorophyll a in surface waters can be calculated by measuring the color of the water ( also referred to as “ocean color”) which can be “seen” by sensors on satellites in space almost like your eyes see the color of the ocean. Environmental and oceanographic factors continuously influence the abundance, species composition, spatial distribution, and productivity of phytoplankton. Tracking the amount of phytoplankton in the ocean conveys the status of the base of the food web, and how much food is available for other animals. Changes in the amount of phytoplankton in the ocean are part of the natural seasonal cycle (similar to seasonal changes of plants on land), but can also indicate an ecosystem’s response to a major external disturbance such as a hurricane or typhoon.
Data Source:
Chlorophyll a concentration values for this indicator were obtained from the NOAA Fisheries Coastal and Oceanic Plankton Ecology, Production, and Observations Database (COPEPOD). Source: https://www.st.nmfs.noaa.gov/copepod/about/about-copepod.html.
To learn more about satellite-based chlorophyll a measurements within NOAA or to supplement the time series data shown here, please visit NOAA CoastWatch for more information and assistance.
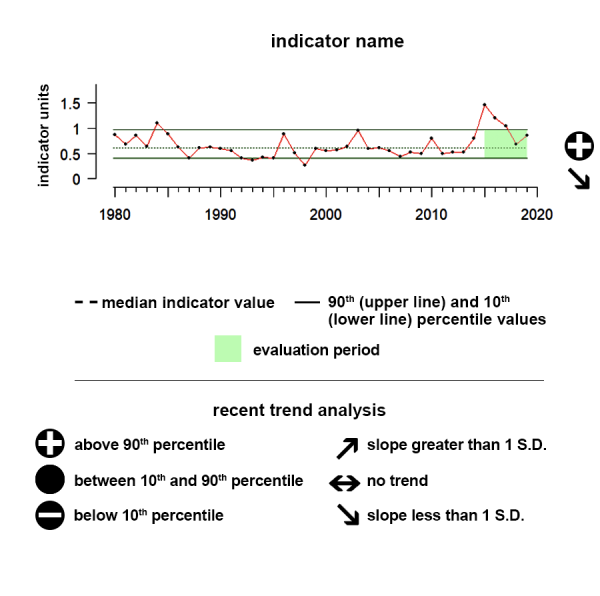
Understanding the Time series plots
Time series plots show the changes in each indicator as a function of time, over the period 1980-present. Each plot also shows horizontal lines that indicate the median (middle) value of that indicator, as well as the 10th and 90th percentiles, each calculated for the entire period of measurement. Time series plots were only developed for datasets with at least 10 years of data. Two symbols located to the right of each plot describe how recent values of an indicator compare against the overall series. A black circle indicates whether the indicator values over the last five years are on average above the series 90th percentile (plus sign), below the 10th percentile (minus sign), or between those two values (solid circle). Beneath that an arrow reflects the trend of the indicator over the last five years; an increase or decrease greater than one standard deviation is reflected in upward or downward arrows respectively, while a change of less than one standard deviation is recorded by a left-right arrow.
Alaska
Eastern Bering Sea
Chlorophyll a, a pigment produced by phytoplankton, can be measured to determine the amount of phytoplankton present in water bodies. From a human perspective, high values of chlorophyll a can be good (abundance of nutritious diatoms as food for fish) or bad (Harmful Algal Blooms that may cause respiratory distress for people), based on the associated phytoplankton species.
Description of time series:
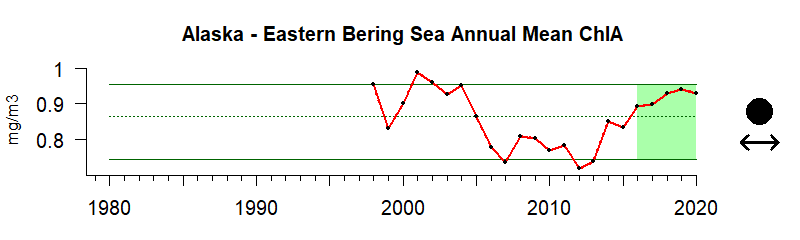
This time series shows the average concentration levels of chlorophyll ɑ for Alaska’s Eastern Bering Sea region. During the last five years there has been no significant trend while values have remained within the 10th and 90th percentiles of all observed data in the time series.
Description of gauge:
The gauge value of 65 indicates that between 2016 and 2020 the average concentration levels of chlorophyll a in Alaska’s Eastern Bering Sea region were slightly higher than the long term median of all chlorophyll ɑ concentration levels between 1998 and 2020.
Gauge values
0–10: Chlorophyll a was significantly lower than the long term median state.
10–25: Chlorophyll a was considerably lower than the long term median state.
25–50: Chlorophyll a was slightly lower than the long term median state.
50: Chlorophyll a was at the long term median state.
50–75: Chlorophyll a was slightly higher than the long term median state.
75–90: Chlorophyll a was considerably higher than the long term median state.
90–100: Chlorophyll a was significantly higher than the long term median state.
Indicator and source information:
The data for this Chlorophyll a annual indicator were provided by the NOAA Fisheries Coastal and Oceanic Plankton Ecology, Production, and Observations Database (COPEPOD). COPEPOD determined the annual Large Marine Ecosystem (LME) chlorophyll a concentrations using mapped, monthly composites of chlorophyll a concentration as calculated from radiance measurements ("ocean color") made by the SeaWiFS and MODIS-Aqua satellite sensors. These monthly composites were obtained from NASA (https://oceancolor.gsfc.nasa.gov/). Annual means for each LME for each year were calculated from the average of the LME 12 monthly means in that year. The overall “National Annual Mean mean was calculated as the average of all LME annual means. See the Data Background section for more details. Source: https://www.st.nmfs.noaa.gov/copepod/about/about-copepod.html.
To learn more about satellite-based chlorophyll a measurements within NOAA or to supplement the time series data shown here, please visit NOAA CoastWatch for more information and assistance.
Data background and limitations:
Satellite chlorophyll a, 9 km mapped, monthly composited data from SeaWiFS and MODIS-Aqua NASA products were spatially re-binned into 0.5 degree latitude by 0.5 degree longitude boxes (nominally about 50 km2 near the equator) then those ~50 km2 box values were averaged over the area of a given LME, resulting in 12 values per LME, one value for each month. The annual LME chlorophyll a amount reported here is the average of those 12 monthly values. This technique was done for each LME from North America and Hawaii. The overall “National Annual Mean mean was calculated as the average of all the LME annual means. Note that chlorophyll a is often plotted on a logarithmic scale to accentuate proportional changes. In other words, small changes in concentration when amounts are relatively low could mean a very big proportional change in the phytoplankton whereas the same change in absolute concentration when concentrations are relatively large is less meaningful.
Alaska
Gulf of Alaska
Chlorophyll a, a pigment produced by phytoplankton, can be measured to determine the amount of phytoplankton present in water bodies. From a human perspective, high values of chlorophyll a can be good (abundance of nutritious diatoms as food for fish) or bad (Harmful Algal Blooms that may cause respiratory distress for people), based on the associated phytoplankton species.
Description of time series:
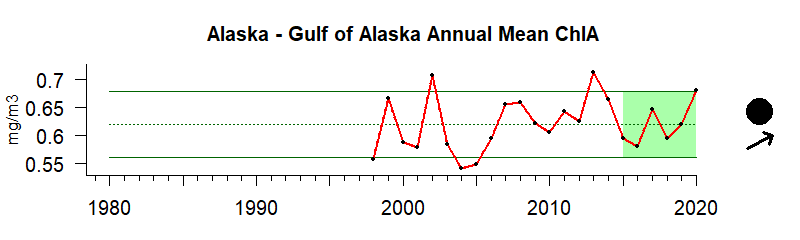
This time series shows the average concentration levels of chlorophyll ɑ for Alaska’s Gulf of Alaska region. During the last five years there has been a significant upward trend while values have remained within the 10th and 90th percentiles of all observed data in the time series
Description of gauge:
The gauge value of 57 indicates that between 2016 and 2020 the average concentration levels of chlorophyll a in the Gulf of Alaska region were slightly higher than the long term median of all chlorophyll ɑ concentration levels between 1998 and 2020.
Gauge values
0–10: Chlorophyll a was significantly lower than the long term median state.
10–25: Chlorophyll a was considerably lower than the long term median state.
25–50: Chlorophyll a was slightly lower than the long term median state.
50: Chlorophyll a was at the long term median state.
50–75: Chlorophyll a was slightly higher than the long term median state.
75–90: Chlorophyll a was considerably higher than the long term median state.
90–100: Chlorophyll a was significantly higher than the long term median state.
Indicator and source information:
The data for this Chlorophyll a annual indicator were provided by the NOAA Fisheries Coastal and Oceanic Plankton Ecology, Production, and Observations Database (COPEPOD). COPEPOD determined the annual Large Marine Ecosystem (LME) chlorophyll a concentrations using mapped, monthly composites of chlorophyll a concentration as calculated from radiance measurements ("ocean color") made by the SeaWiFS and MODIS-Aqua satellite sensors. These monthly composites were obtained from NASA (https://oceancolor.gsfc.nasa.gov/). Annual means for each LME for each year were calculated from the average of the LME 12 monthly means in that year. The overall “National Annual Mean mean was calculated as the average of all LME annual means. See the Data Background section for more details. Source: https://www.st.nmfs.noaa.gov/copepod/about/about-copepod.html.
To learn more about satellite-based chlorophyll a measurements within NOAA or to supplement the time series data shown here, please visit NOAA CoastWatch for more information and assistance.
Data background and limitations:
Satellite chlorophyll a, 9 km mapped, monthly composited data from SeaWiFS and MODIS-Aqua NASA products were spatially re-binned into 0.5 degree latitude by 0.5 degree longitude boxes (nominally about 50 km2 near the equator) then those ~50 km2 box values were averaged over the area of a given LME, resulting in 12 values per LME, one value for each month. The annual LME chlorophyll a amount reported here is the average of those 12 monthly values. This technique was done for each LME from North America and Hawaii. The overall “National Annual Mean mean was calculated as the average of all the LME annual means. Note that chlorophyll a is often plotted on a logarithmic scale to accentuate proportional changes. In other words, small changes in concentration when amounts are relatively low could mean a very big proportional change in the phytoplankton whereas the same change in absolute concentration when concentrations are relatively large is less meaningful.
Hawai'i
Chlorophyll a, a pigment produced by phytoplankton, can be measured to determine the amount of phytoplankton present in water bodies. From a human perspective, high values of chlorophyll a can be good (abundance of nutritious diatoms as food for fish) or bad (Harmful Algal Blooms that may cause respiratory distress for people), based on the associated phytoplankton species.
Description of time series:
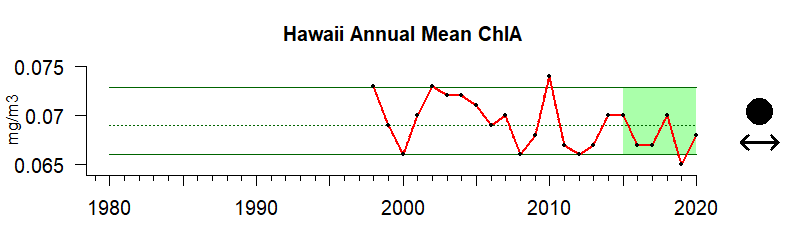
This time series shows the average concentration levels of chlorophyll ɑ for the Hawai‘i region. During the last five years there has been no notable trend and values have remained within the 10th and 90th percentiles of all observed data in the time series.
Description of gauge:
The gauge value of 35 indicates that between 2016 and 2020 the average concentration levels of chlorophyll a in the Hawai‘i region were considerably lower than the long term median of all chlorophyll ɑ concentration levels between 1998 and 2020.
Gauge values
0–10: Chlorophyll a was significantly lower than the long term median state.
10–25: Chlorophyll a was considerably lower than the long term median state.
25–50: Chlorophyll a was slightly lower than the long term median state.
50: Chlorophyll a was at the long term median state.
50–75: Chlorophyll a was slightly higher than the long term median state.
75–90: Chlorophyll a was considerably higher than the long term median state.
90–100: Chlorophyll a was significantly higher than the long term median state.
Indicator and source information:
The data for this Chlorophyll a annual indicator were provided by the NOAA Fisheries Coastal and Oceanic Plankton Ecology, Production, and Observations Database (COPEPOD). COPEPOD determined the annual Large Marine Ecosystem (LME) chlorophyll a concentrations using mapped, monthly composites of chlorophyll a concentration as calculated from radiance measurements ("ocean color") made by the SeaWiFS and MODIS-Aqua satellite sensors. These monthly composites were obtained from NASA (https://oceancolor.gsfc.nasa.gov/). Annual means for each LME for each year were calculated from the average of the LME 12 monthly means in that year. The overall “National Annual Mean mean was calculated as the average of all LME annual means. See the Data Background section for more details. Source: https://www.st.nmfs.noaa.gov/copepod/about/about-copepod.html.
To learn more about satellite-based chlorophyll a measurements within NOAA or to supplement the time series data shown here, please visit NOAA CoastWatch for more information and assistance.
Data background and limitations:
Satellite chlorophyll a, 9 km mapped, monthly composited data from SeaWiFS and MODIS-Aqua NASA products were spatially re-binned into 0.5 degree latitude by 0.5 degree longitude boxes (nominally about 50 km2 near the equator) then those ~50 km2 box values were averaged over the area of a given LME, resulting in 12 values per LME, one value for each month. The annual LME chlorophyll a amount reported here is the average of those 12 monthly values. This technique was done for each LME from North America and Hawaii. The overall “National Annual Mean mean was calculated as the average of all the LME annual means. Note that chlorophyll a is often plotted on a logarithmic scale to accentuate proportional changes. In other words, small changes in concentration when amounts are relatively low could mean a very big proportional change in the phytoplankton whereas the same change in absolute concentration when concentrations are relatively large is less meaningful.
California Current
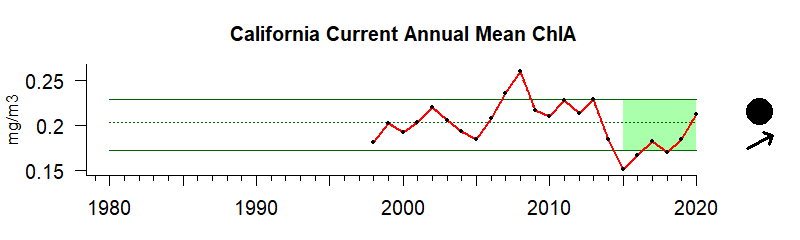
Chlorophyll a, a pigment produced by phytoplankton, can be measured to determine the amount of phytoplankton present in water bodies. From a human perspective, high values of chlorophyll a can be good (abundance of nutritious diatoms as food for fish) or bad (Harmful Algal Blooms that may cause respiratory distress for people), based on the associated phytoplankton species.
Description of time series:
This time series shows the average concentration levels of chlorophyll ɑ for the California Current region. During the last five years there has been a significant upward trend while values have remained within the 10th and 90th percentiles of all observed data in the time series
Description of gauge:
The gauge value of 22 indicates that between 2016 and 2020 the average concentration levels of chlorophyll a in the California Current region were considerably lower than the long term median of all chlorophyll ɑ concentration levels between 1998 and 2020.
Gauge values
0–10: Chlorophyll a was significantly lower than the long term median state.
10–25: Chlorophyll a was considerably lower than the long term median state.
25–50: Chlorophyll a was slightly lower than the long term median state.
50: Chlorophyll a was at the long term median state.
50–75: Chlorophyll a was slightly higher than the long term median state.
75–90: Chlorophyll a was considerably higher than the long term median state.
90–100: Chlorophyll a was significantly higher than the long term median state.
Indicator and source information:
The data for this Chlorophyll a annual indicator were provided by the NOAA Fisheries Coastal and Oceanic Plankton Ecology, Production, and Observations Database (COPEPOD). COPEPOD determined the annual Large Marine Ecosystem (LME) chlorophyll a concentrations using mapped, monthly composites of chlorophyll a concentration as calculated from radiance measurements ("ocean color") made by the SeaWiFS and MODIS-Aqua satellite sensors. These monthly composites were obtained from NASA (https://oceancolor.gsfc.nasa.gov/). Annual means for each LME for each year were calculated from the average of the LME 12 monthly means in that year. The overall “National Annual Mean mean was calculated as the average of all LME annual means. See the Data Background section for more details. Source: https://www.st.nmfs.noaa.gov/copepod/about/about-copepod.html.
To learn more about satellite-based chlorophyll a measurements within NOAA or to supplement the time series data shown here, please visit NOAA CoastWatch for more information and assistance.
Data background and limitations:
Satellite chlorophyll a, 9 km mapped, monthly composited data from SeaWiFS and MODIS-Aqua NASA products were spatially re-binned into 0.5 degree latitude by 0.5 degree longitude boxes (nominally about 50 km2 near the equator) then those ~50 km2 box values were averaged over the area of a given LME, resulting in 12 values per LME, one value for each month. The annual LME chlorophyll a amount reported here is the average of those 12 monthly values. This technique was done for each LME from North America and Hawaii. The overall “National Annual Mean mean was calculated as the average of all the LME annual means. Note that chlorophyll a is often plotted on a logarithmic scale to accentuate proportional changes. In other words, small changes in concentration when amounts are relatively low could mean a very big proportional change in the phytoplankton whereas the same change in absolute concentration when concentrations are relatively large is less meaningful.
Gulf of Mexico
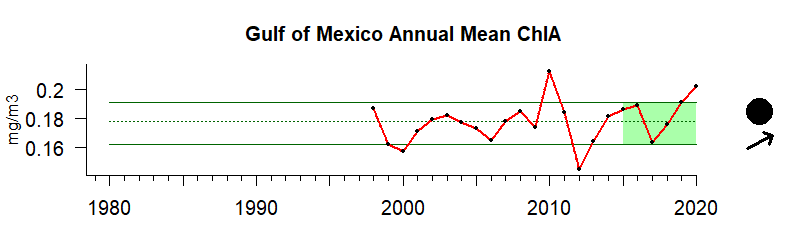
Chlorophyll a, a pigment produced by phytoplankton, can be measured to determine the amount of phytoplankton present in water bodies. From a human perspective, high values of chlorophyll a can be good (abundance of nutritious diatoms as food for fish) or bad (Harmful Algal Blooms that may cause respiratory distress for people), based on the associated phytoplankton species.
Description of time series:
This time series shows the average concentration levels of chlorophyll ɑ for the Gulf of Mexico region. During the last five years there has been a significant upward trend and values have remained within the 10th and 90th percentiles of all observed data in the time series
Description of gauge:
The gauge value of 70 indicates that between 2016 and 2020 the average concentration levels of chlorophyll a in the Gulf of Mexico region were considerably higher than the long term median of all chlorophyll ɑ concentration levels between 1998 and 2020.
Gauge values
0–10: Chlorophyll a was significantly lower than the long term median state.
10–25: Chlorophyll a was considerably lower than the long term median state.
25–50: Chlorophyll a was slightly lower than the long term median state.
50: Chlorophyll a was at the long term median state.
50–75: Chlorophyll a was slightly higher than the long term median state.
75–90: Chlorophyll a was considerably higher than the long term median state.
90–100: Chlorophyll a was significantly higher than the long term median state.
Indicator and source information:
The data for this Chlorophyll a annual indicator were provided by the NOAA Fisheries Coastal and Oceanic Plankton Ecology, Production, and Observations Database (COPEPOD). COPEPOD determined the annual Large Marine Ecosystem (LME) chlorophyll a concentrations using mapped, monthly composites of chlorophyll a concentration as calculated from radiance measurements ("ocean color") made by the SeaWiFS and MODIS-Aqua satellite sensors. These monthly composites were obtained from NASA (https://oceancolor.gsfc.nasa.gov/). Annual means for each LME for each year were calculated from the average of the LME 12 monthly means in that year. The overall “National Annual Mean mean was calculated as the average of all LME annual means. See the Data Background section for more details. Source: https://www.st.nmfs.noaa.gov/copepod/about/about-copepod.html.
To learn more about satellite-based chlorophyll a measurements within NOAA or to supplement the time series data shown here, please visit NOAA CoastWatch for more information and assistance.
Data background and limitations:
Satellite chlorophyll a, 9 km mapped, monthly composited data from SeaWiFS and MODIS-Aqua NASA products were spatially re-binned into 0.5 degree latitude by 0.5 degree longitude boxes (nominally about 50 km2 near the equator) then those ~50 km2 box values were averaged over the area of a given LME, resulting in 12 values per LME, one value for each month. The annual LME chlorophyll a amount reported here is the average of those 12 monthly values. This technique was done for each LME from North America and Hawaii. The overall “National Annual Mean mean was calculated as the average of all the LME annual means. Note that chlorophyll a is often plotted on a logarithmic scale to accentuate proportional changes. In other words, small changes in concentration when amounts are relatively low could mean a very big proportional change in the phytoplankton whereas the same change in absolute concentration when concentrations are relatively large is less meaningful.
Caribbean Sea
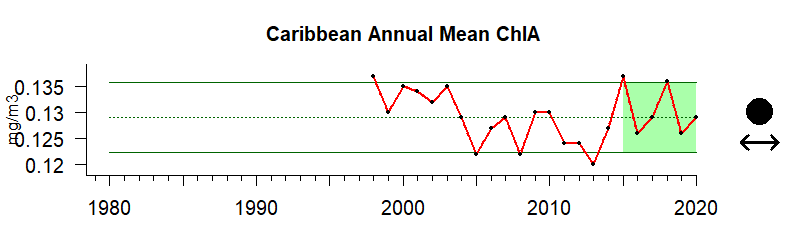
Chlorophyll a, a pigment produced by phytoplankton, can be measured to determine the amount of phytoplankton present in water bodies. From a human perspective, high values of chlorophyll a can be good (abundance of nutritious diatoms as food for fish) or bad (Harmful Algal Blooms that may cause respiratory distress for people), based on the associated phytoplankton species.
Description of time series:
This time series shows the average concentration levels of chlorophyll ɑ for the Caribbean region. During the last five years there has been no notable trend and values have remained within the 10th and 90th percentiles of all observed data in the time series.
Description of gauge:
The gauge value of 57 indicates that between 2016 and 2020 the average concentration levels of chlorophyll a in the Caribbean region were slightly higher than the long term median of all chlorophyll ɑ concentration levels between 1998 and 2020.
Gauge values
0–10: Chlorophyll a was significantly lower than the long term median state.
10–25: Chlorophyll a was considerably lower than the long term median state.
25–50: Chlorophyll a was slightly lower than the long term median state.
50: Chlorophyll a was at the long term median state.
50–75: Chlorophyll a was slightly higher than the long term median state.
75–90: Chlorophyll a was considerably higher than the long term median state.
90–100: Chlorophyll a was significantly higher than the long term median state.
Indicator and source information:
The data for this Chlorophyll a annual indicator were provided by the NOAA Fisheries Coastal and Oceanic Plankton Ecology, Production, and Observations Database (COPEPOD). COPEPOD determined the annual Large Marine Ecosystem (LME) chlorophyll a concentrations using mapped, monthly composites of chlorophyll a concentration as calculated from radiance measurements ("ocean color") made by the SeaWiFS and MODIS-Aqua satellite sensors. These monthly composites were obtained from NASA (https://oceancolor.gsfc.nasa.gov/). Annual means for each LME for each year were calculated from the average of the LME 12 monthly means in that year. The overall “National Annual Mean mean was calculated as the average of all LME annual means. See the Data Background section for more details. Source: https://www.st.nmfs.noaa.gov/copepod/about/about-copepod.html.
To learn more about satellite-based chlorophyll a measurements within NOAA or to supplement the time series data shown here, please visit NOAA CoastWatch for more information and assistance.
Data background and limitations:
Satellite chlorophyll a, 9 km mapped, monthly composited data from SeaWiFS and MODIS-Aqua NASA products were spatially re-binned into 0.5 degree latitude by 0.5 degree longitude boxes (nominally about 50 km2 near the equator) then those ~50 km2 box values were averaged over the area of a given LME, resulting in 12 values per LME, one value for each month. The annual LME chlorophyll a amount reported here is the average of those 12 monthly values. This technique was done for each LME from North America and Hawaii. The overall “National Annual Mean mean was calculated as the average of all the LME annual means. Note that chlorophyll a is often plotted on a logarithmic scale to accentuate proportional changes. In other words, small changes in concentration when amounts are relatively low could mean a very big proportional change in the phytoplankton whereas the same change in absolute concentration when concentrations are relatively large is less meaningful.
Southeast US
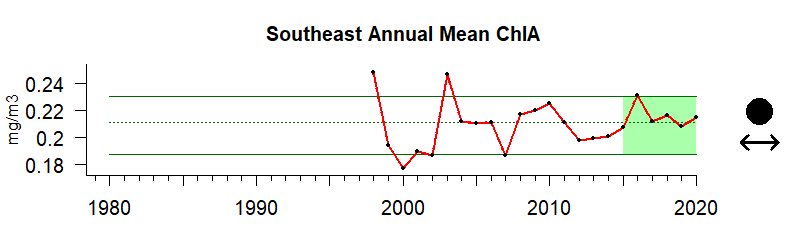
Chlorophyll a, a pigment produced by phytoplankton, can be measured to determine the amount of phytoplankton present in water bodies. From a human perspective, high values of chlorophyll a can be good (abundance of nutritious diatoms as food for fish) or bad (Harmful Algal Blooms that may cause respiratory distress for people), based on the associated phytoplankton species.
Description of time series:
This time series shows the average concentration levels of chlorophyll ɑ for the Southeast US region. During the last five years there has been no notable trend and values were between the 10th and 90th percentiles of all observed data in the time series.
Description of gauge:
The gauge value of 74 indicates that between 2016 and 2020 the average concentration levels of chlorophyll a in the Southeast US region were significantly higher than the long term median of all chlorophyll ɑ concentration levels between 1998 and 2020.
Gauge values
0–10: Chlorophyll a was significantly lower than the long term median state.
10–25: Chlorophyll a was considerably lower than the long term median state.
25–50: Chlorophyll a was slightly lower than the long term median state.
50: Chlorophyll a was at the long term median state.
50–75: Chlorophyll a was slightly higher than the long term median state.
75–90: Chlorophyll a was considerably higher than the long term median state.
90–100: Chlorophyll a was significantly higher than the long term median state.
Indicator and source information:
The data for this Chlorophyll a annual indicator were provided by the NOAA Fisheries Coastal and Oceanic Plankton Ecology, Production, and Observations Database (COPEPOD). COPEPOD determined the annual Large Marine Ecosystem (LME) chlorophyll a concentrations using mapped, monthly composites of chlorophyll a concentration as calculated from radiance measurements ("ocean color") made by the SeaWiFS and MODIS-Aqua satellite sensors. These monthly composites were obtained from NASA (https://oceancolor.gsfc.nasa.gov/). Annual means for each LME for each year were calculated from the average of the LME 12 monthly means in that year. The overall “National Annual Mean mean was calculated as the average of all LME annual means. See the Data Background section for more details. Source: https://www.st.nmfs.noaa.gov/copepod/about/about-copepod.html.
To learn more about satellite-based chlorophyll a measurements within NOAA or to supplement the time series data shown here, please visit NOAA CoastWatch for more information and assistance.
Data background and limitations:
Satellite chlorophyll a, 9 km mapped, monthly composited data from SeaWiFS and MODIS-Aqua NASA products were spatially re-binned into 0.5 degree latitude by 0.5 degree longitude boxes (nominally about 50 km2 near the equator) then those ~50 km2 box values were averaged over the area of a given LME, resulting in 12 values per LME, one value for each month. The annual LME chlorophyll a amount reported here is the average of those 12 monthly values. This technique was done for each LME from North America and Hawaii. The overall “National Annual Mean mean was calculated as the average of all the LME annual means. Note that chlorophyll a is often plotted on a logarithmic scale to accentuate proportional changes. In other words, small changes in concentration when amounts are relatively low could mean a very big proportional change in the phytoplankton whereas the same change in absolute concentration when concentrations are relatively large is less meaningful.
Northeast US
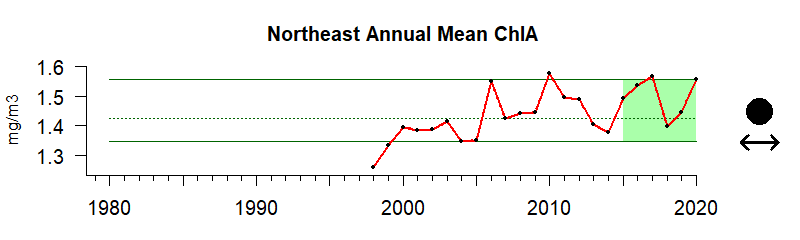
Chlorophyll a, a pigment produced by phytoplankton, can be measured to determine the amount of phytoplankton present in water bodies. From a human perspective, high values of chlorophyll a can be good (abundance of nutritious diatoms as food for fish) or bad (Harmful Algal Blooms that may cause respiratory distress for people), based on the associated phytoplankton species.
Description of time series:
This time series shows the average concentration levels of chlorophyll ɑ for the Northeast US region. During the last five years there has been no notable trend and values have remained within the 10th and 90th percentiles of all observed data in the time series.
Description of gauge:
The gauge value of 78 indicates that between 2016 and 2020 the average concentration levels of chlorophyll a in the Northeast US region were considerably higher than the long term median of all chlorophyll ɑ concentration levels between 1998 and 2020.
Gauge values
0–10: Chlorophyll a was significantly lower than the long term median state.
10–25: Chlorophyll a was considerably lower than the long term median state.
25–50: Chlorophyll a was slightly lower than the long term median state.
50: Chlorophyll a was at the long term median state.
50–75: Chlorophyll a was slightly higher than the long term median state.
75–90: Chlorophyll a was considerably higher than the long term median state.
90–100: Chlorophyll a was significantly higher than the long term median state.
Indicator and source information:
The data for this Chlorophyll a annual indicator were provided by the NOAA Fisheries Coastal and Oceanic Plankton Ecology, Production, and Observations Database (COPEPOD). COPEPOD determined the annual Large Marine Ecosystem (LME) chlorophyll a concentrations using mapped, monthly composites of chlorophyll a concentration as calculated from radiance measurements ("ocean color") made by the SeaWiFS and MODIS-Aqua satellite sensors. These monthly composites were obtained from NASA (https://oceancolor.gsfc.nasa.gov/). Annual means for each LME for each year were calculated from the average of the LME 12 monthly means in that year. The overall “National Annual Mean mean was calculated as the average of all LME annual means. See the Data Background section for more details. Source: https://www.st.nmfs.noaa.gov/copepod/about/about-copepod.html.
To learn more about satellite-based chlorophyll a measurements within NOAA or to supplement the time series data shown here, please visit NOAA CoastWatch for more information and assistance.
Data background and limitations:
Satellite chlorophyll a, 9 km mapped, monthly composited data from SeaWiFS and MODIS-Aqua NASA products were spatially re-binned into 0.5 degree latitude by 0.5 degree longitude boxes (nominally about 50 km2 near the equator) then those ~50 km2 box values were averaged over the area of a given LME, resulting in 12 values per LME, one value for each month. The annual LME chlorophyll a amount reported here is the average of those 12 monthly values. This technique was done for each LME from North America and Hawaii. The overall “National Annual Mean mean was calculated as the average of all the LME annual means. Note that chlorophyll a is often plotted on a logarithmic scale to accentuate proportional changes. In other words, small changes in concentration when amounts are relatively low could mean a very big proportional change in the phytoplankton whereas the same change in absolute concentration when concentrations are relatively large is less meaningful.

Resources
MODIS Aqua NIR-SWIR Ocean Color Chlorophyll Concentration: Daily - OSPO
The MODIS/Aqua NIR-SWIR ocean color products are derived by using the shortwave infrared (SWIR)-based atmospheric correction algorithm developed by the NOAA/NESDIS Center for Satellite Applications and Research (STAR). The products include chlorophyll concentration, remote sensing reflectance at 667 nm, water attenuation coefficient at 490 nm over 12 CoastWatch Regions-of-Interest, i.e., Northeast (NE), Southeast (SE), Gulf of Mexico (GOM), Caribbean (CB), West Coast (WC), Alaska (AK), East Tropical Pacific (EP), Equatorial Atlantic (EA), Great Lakes (GL), Hawaii (HI), North Atlantic (NA), and Pacific Basin (PB).
MODIS / Aqua NASA L2gen NIR Ocean Color Chlorophyll Concentration (Chl-a): Daily - OSPO
The MODIS/Terra ocean color products are derived by using the NASA L2gen SeaDAS codes based on Near-Infrared (NIR) atmospheric correction algorithm. The products include chlorophyll concentration and remote sensing reflectance at 667 nm over 2 CoastWatch Regions-of-Interest, i.e., Gulf of Mexico (GOM) and Hawaii (HI).
NCEI Ocean Color Archive
This site contains an overview of the NOAA archive services being provided for Level 2 (L2) and Level 3 (L3) ocean color (OC) products generated by the NOAA CoastWatch/OceanWatch Program (a.k.a CoastWatch). CoastWatch is an operational NOAA program that processes near real-time satellite data and makes it available to a variety of users in order to manage U.S. coastal resources and understand climate variability. CoastWatch currently produces near real-time ocean color products from multiple platforms.

Satellite Data Products | NOAA CoastWatch & OceanWatch
Guide to satellite data products hosted by the NOAA Coastwatch and Oceanwatch websites.

PSL Real-time Satellite Products
Real-time data products hosted by NOAA's Physical Sciences Laboratory

NASA Ocean Color
NASA's OceanColor Web is supported by the Ocean Biology Processing Group (OBPG) at NASA's Goddard Space Flight Center. Our responsibilities include the collection, processing, calibration, validation, archive and distribution of ocean-related products from a large number of operational, satellite-based remote-sensing missions providing ocean color, sea surface temperature and sea surface salinity data to the international research community since 1996.

MODIS Chlorophyll-a Concentration
This algorithm returns the near-surface concentration of chlorophyll-a (chlor_a) in mg m-3, calculated using an empirical relationship derived from in situ measurements of chlor_a and blue-to-green band ratios of in situ remote sensing reflectances (Rrs). Implementation is contingent on the availability three or more sensor bands spanning the 440 - 570 nm spectral regime. The algorithm is applicable to all current ocean color sensors. The chlor_a product is included as part of the standard Level-2 OC product suite and the Level-3 CHL product suite.

Phytoplankton Monitoring Network (PMN)
The National Phytoplankton Monitoring Network (PMN) is a community-based network of volunteers monitoring marine phytoplankton and harmful algal blooms (HABs). PMN recognizes the interrelationships between humans and coastal ecosystems while providing volunteer citizen scientists with meaningful opportunities for hands-on science engagement. The PMN enhances the Nation’s ability to respond to and manage the growing threat posed by HABs by collecting important data for species composition and distribution in coastal waters and creating working relationships between volunteers and professional marine biotoxin researchers.

Ocean - Oceanic Climate Variables
This page describes some of the 50 Essential Climate Variables identified by the Global Climate Observing System (GCOS) for worldwide monitoring. Panels of experts at GCOS helped identify which climate observations should be made on an ongoing basis, and agreed upon principles and guidelines for the best ways to make them.

GOOS Essential Ocean Variables
The ocean environment is vast, remote, and harsh, and the cost involved in its observation are high. There is a need to avoid duplication of efforts, across observing platforms and networks, and to adopt common standards for data collection and dissemination to maximize the utility of data. To address these concerns, the Framework is designed to approach ocean observations with a focus on Essential Ocean Variables, ensuring assessments that cut across platforms and recommend the best, most cost effective plan to provide an optimal global view for each EOV.

GOOS-EOV-Ocean-Colour
The Essential Ocean Variable Sheet and Criteria for ocean colour

IOOS Core Variables
The 34 IOOS Core Variables: Ocean observing measurements required to detect and predict changes in the ocean

Gulf of Mexico Harmful Algal Bloom Forecast
In the Gulf of Mexico, some harmful algal blooms are caused by the rapid growth of the microscopic algae species Karenia brevis (commonly called red tide). Red tide can cause respiratory illness and eye irritation in humans. It can also kill marine life. Blooms are often patchy, so impacts vary by beach and throughout the day.
NOAA monitors conditions daily and issues twice-weekly forecasts for red tide blooms in the Gulf of Mexico and East Coast of Florida. You can find up-to-date information on where a bloom is located and a 3–4 day forecast for potential respiratory irritation by selecting a region below. This information may help you find an unaffected beach if you are visiting the coast

The Global Plankton Database
COPEPOD's global plankton database component provides plankton and ecosystem researchers with an integrated data set of quality-reviewed, globally distributed plankton abundance, biomass and composition data. Its visual, interactive interface is designed to help the user see exactly what data are currently available and then download them in a variety of usable formats and compilations. In addition to data distribution maps, COPEPOD offers a variety of text and graphical content summaries and searching options.

NCCOS Harmful Algal Bloom Forecasting
Our HAB forecasts alert coastal managers to blooms before they cause serious damage. Short-term (once or twice weekly) forecasts identify which blooms are potentially harmful, where they are, how big they are, and where they're likely headed. Longer-term, seasonal forecasts predict the severity of HABs for the bloom season in a particular region. Early warning provides health officials, environmental managers and water treatment facility operators information to focus their testing to guide beach and shellfish bed closures or water treatment in a more appropriate timeframe. They also allow the seafood and tourism industries to minimize impacts.
