
Description of seabirds:
Seabirds are a vital part of marine ecosystems and valuable indicators of an ecosystem’s status. Seabirds are attracted to fishing vessels and frequently get hooked or entangled in fishing gear, especially longline fisheries. This is a common threat to seabirds. Depending on the geographic region, fishermen in the United States often interact with albatross, cormorants, gannet, loons, pelicans, puffins, gulls, storm-petrels, shearwaters, terns, and many other species. We track seabirds because of their importance to marine food webs, but also as an indication of efficient fishing practices. We present estimates of seabird abundance in the Alaska, California Current, Gulf of Mexico and Northeast regions.
Data sources:
Data for Alaska, California Current, and the Gulf of Mexico were obtained from the regional NOAA Integrated Ecosystem Assessment Program teams that produce indicators and Ecosystem Status Reports. For more information see https://www.integratedecosystemassessment.noaa.gov/. Seabird count and transect length data for the Northeast were extracted from the Atlantic Marine Assessment Program for Protected Species (AMAPPS) annual reports. Counts were summed and divided by the sum of the transect length in nautical miles. For more information see https://www.nefsc.noaa.gov/psb/AMAPPS/
Understanding the Time series plots
Time series plots show the changes in each indicator as a function of time, over the period 1980-present. Each plot also shows horizontal lines that indicate the median (middle) value of that indicator, as well as the 10th and 90th percentiles, each calculated for the entire period of measurement. Time series plots were only developed for datasets with at least 10 years of data. Two symbols located to the right of each plot describe how recent values of an indicator compare against the overall series. A black circle indicates whether the indicator values over the last five years are on average above the series 90th percentile (plus sign), below the 10th percentile (minus sign), or between those two values (solid circle). Beneath that an arrow reflects the trend of the indicator over the last five years; an increase or decrease greater than one standard deviation is reflected in upward or downward arrows respectively, while a change of less than one standard deviation is recorded by a left-right arrow.
Alaska
Eastern Bering Sea subregion
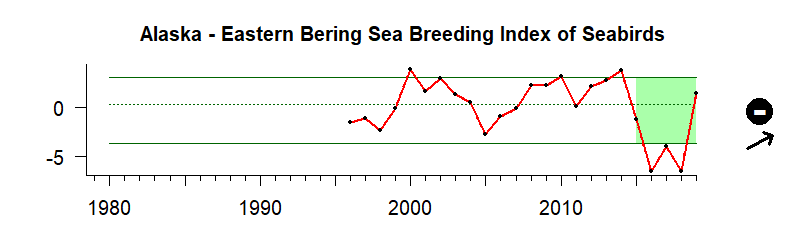
alues indicate estimated seabird abundance using a relative breeding index
Description of time series:
Between 2015 and 2019 the seabird breeding index showed no significant trend.
Description of gauge:
The gauge value of 12 indicates that between 2015 and 2019 the seabird breeding index in Alaska (Eastern Bering Sea) was much lower than the median of all breeding index values between 1996 and 2019.
Overall Scores means the following:
- 0 - 10: The five-year seabirds average is very low compared to the median value.
- 10 - 25: The five-year seabirds average is much lower than the median value.
- 25 - 50: The five-year seabirds average is lower than the median value.
- 50: The five-year seabirds average equals the median value.
- 50 - 75: The five-year seabirds average is higher than the median value.
- 75 - 90: The five-year seabirds average is much higher than the median value.
- 90 - 100: The five-year seabirds average is very high compared to the median value.
Description of seabirds:
Seabirds are a vital part of marine ecosystems and valuable indicators of an ecosystem’s status. Seabirds are attracted to fishing vessels and frequently get hooked or entangled in fishing gear, especially longline fisheries. This is a common threat to seabirds. Depending on the geographic region, fishermen in the United States often interact with albatross, cormorants, gannet, loons, pelicans, puffins, gulls, storm-petrels, shearwaters, terns, and many other species. We track seabirds because of their importance to marine food webs, but also as an indication of efficient fishing practices.
Indicator and Source Information:
This data was compiled by the US Fish and Wildlife Service and the multivariate index is calculated by a NOAA author. The Alaska Maritime National Wildlife Refuge has monitored seabirds at colonies around Alaska in most years since the early- to mid-1970’s. Time series of annual breeding success and phenology (among other parameters) are available from over a dozen species at eight Refuge sites in the Gulf of Alaska, Aleutian Islands, and Bering and Chukchi Seas. Monitored colonies in the eastern Bering Sea include St. Paul and St. George Islands. Here, we focus on cliff-nesting, primarily fish-eating species: black-legged kittiwake (Rissa tridactyla), red-legged kittwake (R. brevirostris), common murre (Uria aalge), thick-billed murre (U. lomvia), and redfaced cormorants (Phalacrocorax urile). Reproductive success is defined as the proportion of nest sites with eggs (or just eggs for murres that do not build nests) that fledged a chick.
Data Background and Caveats:
Data only include the species listed above in the Eastern Bering Sea Sub Region of Alaska. Reproductive activity of central-place foraging seabirds can reflect ecosystem conditions at multiple spatial and temporal scales. For piscivorous species that feed at higher trophic levels, continued reduced reproductive success may indicate that the ecosystem has not yet shifted back from warm conditions and/or there is a lagged response of the prey. Despite environmental changes returning back to more neutral conditions, seabird foraging conditions do not appear to have recovered in the eastern Bering Sea. In contrast, the improvement in attendance and minimal reproductive activity among murres in the Gulf of Alaska during 2017 indicates some improvement in foraging conditions for those species. Data can be directly accessed here: https://apps-afsc.fisheries.noaa.gov/refm/reem/ecoweb/Index.php?ID=9
California Current
Cassin’s Auklet Spring Southern California Current
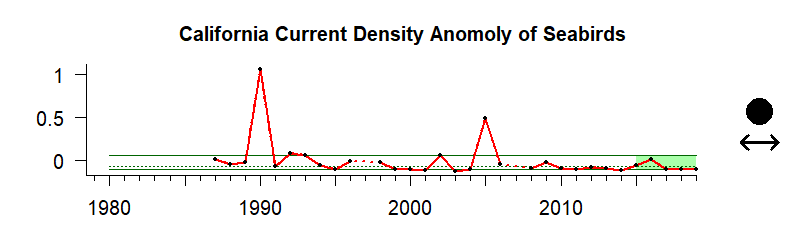
Values indicate estimated seabird abundance using a relative population anomaly score
Description of time series:
Between 2015 and 2019 the seabird density anomaly showed no significant trend.
Description of gauge:
The gauge value of 48 indicates that between 2015 and 2019 the seabird density anomaly (Cassins Auklet spring) in the California Current region (Southern) was lower than the median of all density anomaly values between 1987 and 2019.
Overall Scores means the following:
- 0 - 10: The five-year seabirds average is very low compared to the median value.
- 10 - 25: The five-year seabirds average is much lower than the median value.
- 25 - 50: The five-year seabirds average is lower than the median value.
- 50: The five-year seabirds average equals the median value.
- 50 - 75: The five-year seabirds average is higher than the median value.
- 75 - 90: The five-year seabirds average is much higher than the median value.
- 90 - 100: The five-year seabirds average is very high compared to the median value.
Indicator and Source Information:
Data are from CalCOFI surveys (http://calcofi.org/field-work/underway-observations/380-bird-observations.html), courtesy of Dr. Bill Sydeman of the Farallon Institute (wsydeman@faralloninstitute.org) and displays information about Cassin’s Auklet (Ptychoramphus aleuticus) observed in Spring. Data are shipboard counts, transformed as ln(bird density/km2 +1) and expressed as an anomaly of log density relative to the long-term mean.
Data Background and Caveats:
Data displayed here only represent the estimated density of one species for one season in one region of the California Current Ecosystem. Values for the last three years are exactly the same, as the number of individuals identified has been the same.
Gulf of Mexico
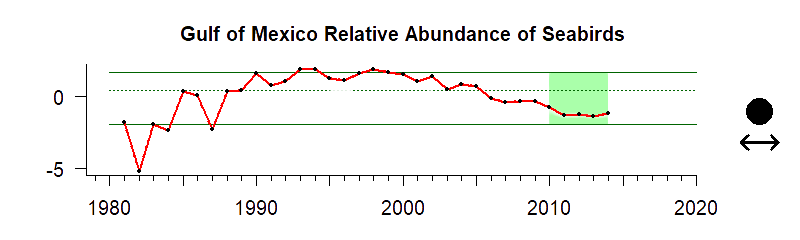
Values indicate the relative seabird abundance in the Gulf of Mexico based on a Relative Abundance Index.
Description of time series:
Between 2000 and 2014 the relative abundance of seabirds showed no significant trend.
Description of gauge:
The Gauge value of 26 indicates that between 2010 and 2014 the relative abundance of seabirds in the Gulf of Mexico was much lower than the mean of all the relative abundance values between 1981 and 2018.
Overall Scores means the following:
- 0 - 10: The five-year seabirds average is very low compared to the median value.
- 10 - 25: The five-year seabirds average is much lower than the median value.
- 25 - 50: The five-year seabirds average is lower than the median value.
- 50: The five-year seabirds average equals the median value.
- 50 - 75: The five-year seabirds average is higher than the median value.
- 75 - 90: The five-year seabirds average is much higher than the median value.
- 90 - 100: The five-year seabirds average is very high compared to the median value.
Indicator and Source Information:
To construct relative indices of abundance, the Gulf of Mexico Integrated Ecosystem Assessment Program used the Cornell Lab of Ornithology’s eBird database, an extensive, standardized compilation of volunteer and professional bird sighting observations (www.eBird.com). Relative indices of abundance for five species ); white ibis (Eudocimus albus), wood stork (Mycteria americana), and roseate spoonbill (Platalea ajaja), brown pelican (Pelecanus occidentalis) and magnificent frigatebird (Fregata magnificens); were used to conduct a principal components analysis of the matrix of species abundances over time to find common linear trends among species. The unitless index is a representation of the overall rate change in abundances across the entire suite of species (2017 Ecosystem status report update for the Gulf of Mexico. NOAA Technical Memorandum NMFS-SEFSC-706).
Data Background and Caveats:
Ideally, abundance indices for true pelagic seabirds would be presented, as they would be more representative of the state of the pelagic ecosystem and the quality of the larger-scale forage base in the GoM (2017 Ecosystem status report update for the Gulf of Mexico. NOAA Technical Memorandum NMFS-SEFSC-706).
Northeast
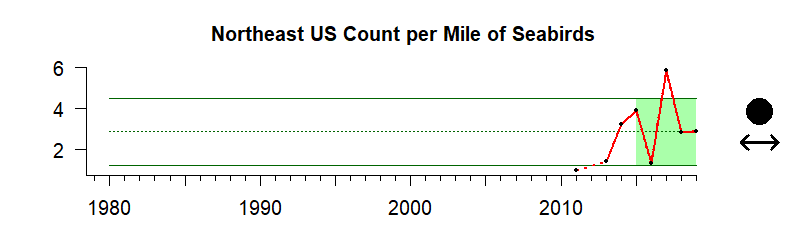
Values indicate estimated seabird abundance based off of the number of seabirds identified by kilometer on Atlantic Marine Assessment Program for Protected Species research cruises
Description of time series:
Between 2011 and 2019 the seabird count per nautical mile showed no significant trend.
Description of gauge:
The gauge value of 76 indicates that the number of seabirds counted per mile in the Northeast on Atlantic Marine Assessment Program for Protected Species research cruises between 2015 and 2019 was much greater than the median number of all seabirds counted between 2011 and 2019
Overall Scores means the following:
- 0 - 10: The five-year seabirds average is very low compared to the median value.
- 10 - 25: The five-year seabirds average is much lower than the median value.
- 25 - 50: The five-year seabirds average is lower than the median value.
- 50: The five-year seabirds average equals the median value.
- 50 - 75: The five-year seabirds average is higher than the median value.
- 75 - 90: The five-year seabirds average is much higher than the median value.
- 90 - 100: The five-year seabirds average is very high compared to the median value.
Indicator and source information:
Seabird count and transect length data for the Northeast are extracted from the Atlantic Marine Assessment Program for Protected Species (AMAPPS) annual reports. Counts for all seabirds observed are summed and divided by the sum of the transect length in nautical miles.

Resources
Atlantic Marine Assessment Program for Protected Species
We conduct surveys and develop abundance and distribution models to better understand how protected species such as whales, dolphins, and sea turtles use our waters.

Seabirds Cordell Bank National Marine Sanctuary
Cordell Bank National Marine Sanctuary protects an area of 1,286 square miles in one of the most productive offshore regions in North America! The sanctuary is located about 43 nautical miles northwest of San Francisco, California, and is entirely offshore, with the eastern boundary five miles from shore. The undersea oasis of Cordell Bank and the surrounding waters teem with life and provide food for hundreds of thousands of seabirds that travel from the Farallon Islands and the Point Reyes peninsula or that have migrated thousands of miles from Alaska, Hawai’i, Australia, New Zealand, and South America! Cordell Bank is also known as the albatross capital of the Northern Hemisphere because five different species have been documented there. At least 75 species of seabirds have been observed throughout the sanctuary.

Arctic Seabirds
A short article about the importance of arctic seabirds from NOAA's OER Hidden Ocean 2016 Expedition.

California Current IEA Seabirds Indicator
The IEA Program evaluates the status of the California Current Ecosystem by interpreting a variety of environmental, biological, economic, and social indicators. Current and historical indicator data are organized categorically with a graphic showing the most recent 5-year trend and status relative to the long-term mean; the graphical interface allows for dynamic plotting and data download options. Many of these indicators are presented to the Pacific Fishery Management Council in annual status reports.