
Description of Recreational Fishing (Effort and Harvest):
U.S. saltwater recreational fishing is an important source of seafood, jobs, and recreation for millions of anglers and for-hire recreational businesses. Recreational fishing effort is measured as “Angler Trips”, which is the number of recreational fishing trips people go on. Recreational fishing harvest is the number of fish caught and brought to shore on recreational fishing trips.
Recreational effort and harvest help us understand how recreational opportunities and seafood derived from our marine environment is changing over time. Fisheries managers use this data to set annual catch limits and fishing regulations, including season lengths, size, and daily catch limits. We present the total number of fish harvested and angler trips annually for all marine fish in all regions.
Data Source:
Recreational harvest and effort data pulled from National Summary Query at https://www.st.nmfs.noaa.gov/recreational-fisheries/data-and-documentation/queries/index. Units of data are Effort in Angler Trips and Harvest in numbers of fish.
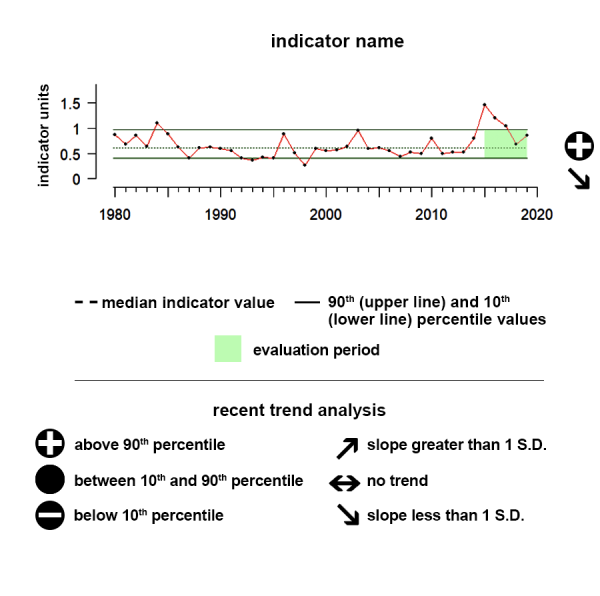
Understanding the Time series plots
Time series plots show the changes in each indicator as a function of time, over the period 1980-present. Each plot also shows horizontal lines that indicate the median (middle) value of that indicator, as well as the 10th and 90th percentiles, each calculated for the entire period of measurement. Time series plots were only developed for datasets with at least 10 years of data. Two symbols located to the right of each plot describe how recent values of an indicator compare against the overall series. A black circle indicates whether the indicator values over the last five years are on average above the series 90th percentile (plus sign), below the 10th percentile (minus sign), or between those two values (solid circle). Beneath that an arrow reflects the trend of the indicator over the last five years; an increase or decrease greater than one standard deviation is reflected in upward or downward arrows respectively, while a change of less than one standard deviation is recorded by a left-right arrow.
Alaska
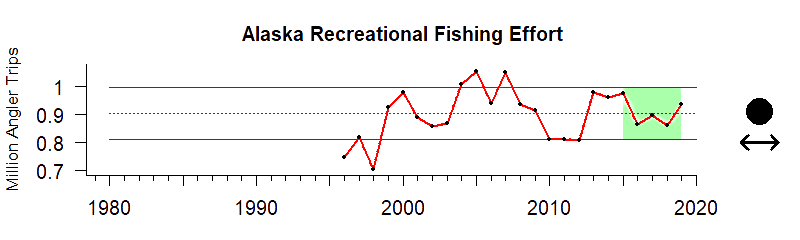
Values correspond to cumulative number of angler trips
Description of time series:
Between 2014 and 2019, recreational fishing effort from Alaska is around historic levels. There is no significant trend apparent.
Description of gauge:
The gauge value of 50 indicates that the recreational fishing effort between 2015 and 2019 for Alaska was the median value for the recreational fishing effort values between 1996 and 2019
Extreme Gauge values:
A value of zero on the gauge means that the average effort or harvest over the last 5 years of data was below any annual value up until that point, while a value of 100 would indicate the average value over that same period was above any annual value up until that point.
Indicator Source Information
Recreational harvest and effort data pulled from National Summary Query. Units of data are in Effort in Angler Trips and Harvest in numbers of fish.The data from these queries is used by state, regional and federal fisheries scientists and managers to maintain healthy and sustainable fish stocks.
Data Background and Caveats:
To properly interpret this information, it is important to consider the following key points:
- When comparing harvest estimates across an extended time series, note differences in sampling coverage through the years. Some estimates may not be comparable over long time series.
- Changes may occur between preliminary and final estimates and year to year, meaning that the data may change when updated. Please review the Limitations and other sections on the Using the Data page from the source for more information.
Hawai'i
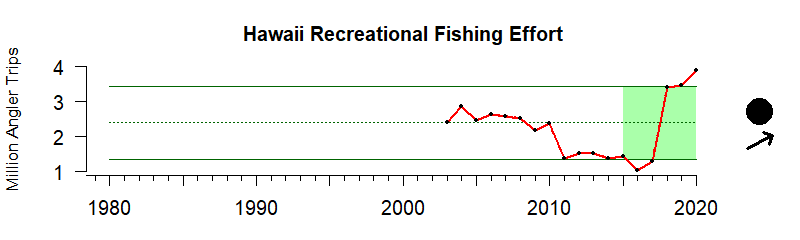
Values correspond to cumulative number of angler trips
Description of time series:
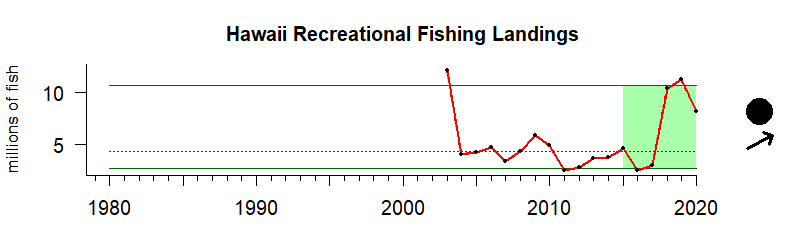
Between 2016 and 2020, recreational fishing effort in the Hawaiʻi-Pacific Islands is around historic levels and shows a significant upward trend.
Description of gauge:
The gauge value of 72 indicates that the recreational fishing effort between 2016 and 2020 for Hawaiʻi and the Pacific Islands was higher than 72% of the recreational fishing effort values between 2003 and 2020
Extreme Gauge values:
A value of zero on the gauge means that the average effort or harvest over the last 5 years of data was below any annual value up until that point, while a value of 100 would indicate the average value over that same period was above any annual value up until that point.
Indicator Source Information
Recreational harvest and effort data pulled from National Summary Query. Units of data are in Effort in Angler Trips and Harvest in numbers of fish.The data from these queries is used by state, regional and federal fisheries scientists and managers to maintain healthy and sustainable fish stocks.
Data Background and Caveats:
To properly interpret this information, it is important to consider the following key points:
- When comparing harvest estimates across an extended time series, note differences in sampling coverage through the years. Some estimates may not be comparable over long time series.
- Changes may occur between preliminary and final estimates and year to year, meaning that the data may change when updated. Please review the Limitations and other sections on the Using the Data page from the source for more information.
California Current
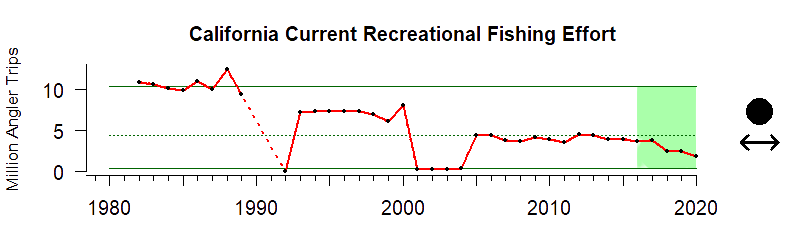
Values correspond to cumulative number of angler trips
Description of time series:
Between 2016 and 2020, recreational fishing effort in California Current is similar to historic levels and shows no trend.
Description of gauge:
The gauge value of 22 indicates that the recreational fishing effort between 2016 and 2020 for the California Current was higher than only 22% of the recreational fishing effort values between 1982 and 2020
Extreme Gauge values:
A value of zero on the gauge means that the average effort or harvest over the last 5 years of data was below any annual value up until that point, while a value of 100 would indicate the average value over that same period was above any annual value up until that point.
Indicator Source Information
Recreational harvest and effort data pulled from National Summary Query. Units of data are in Effort in Angler Trips and Harvest in numbers of fish.The data from these queries is used by state, regional and federal fisheries scientists and managers to maintain healthy and sustainable fish stocks.
Data Background and Caveats:
To properly interpret this information, it is important to consider the following key points:
- When comparing harvest estimates across an extended time series, note differences in sampling coverage through the years. Some estimates may not be comparable over long time series.
- Changes may occur between preliminary and final estimates and year to year, meaning that the data may change when updated. Please review the Limitations and other sections on the Using the Data page from the source for more information.
Gulf of Mexico
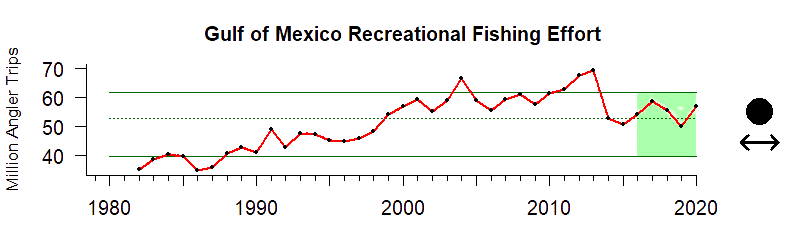
Values correspond to cumulative number of angler trips
Description of time series:
Between 2016 and 2020, recreational fishing effort in the Gulf of Mexico is around historic levels. There is no trend apparent.
Description of gauge:
The gauge value of 56 indicates that the recreational fishing effort between 2016 and 2020 for the Gulf of Mexico was higher than 56% of the recreational fishing effort values between 1982 and 2020
Extreme Gauge values:
A value of zero on the gauge means that the average effort or harvest over the last 5 years of data was below any annual value up until that point, while a value of 100 would indicate the average value over that same period was above any annual value up until that point.
Indicator Source Information
Recreational harvest and effort data pulled from National Summary Query. Units of data are in Effort in Angler Trips and Harvest in numbers of fish.The data from these queries is used by state, regional and federal fisheries scientists and managers to maintain healthy and sustainable fish stocks.
Data Background and Caveats:
To properly interpret this information, it is important to consider the following key points:
- When comparing harvest estimates across an extended time series, note differences in sampling coverage through the years. Some estimates may not be comparable over long time series.
- Changes may occur between preliminary and final estimates and year to year, meaning that the data may change when updated. Please review the Limitations and other sections on the Using the Data page from the source for more information.
Southeast US
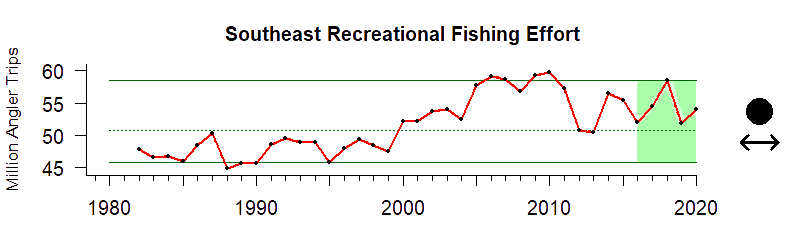
Values correspond to cumulative number of angler trips
Description of time series:
Between 2016 and 2020, recreational fishing effort in Southeast is around historic levels and shows no trend.
Description of gauge:
The gauge value of 72 indicates that the recreational fishing effort between 2016 and 2020 for the Southeast US was higher than 72% of the recreational fishing effort values between 1982 and 2020
Extreme Gauge values:
A value of zero on the gauge means that the average effort or harvest over the last 5 years of data was below any annual value up until that point, while a value of 100 would indicate the average value over that same period was above any annual value up until that point.
Indicator Source Information
Recreational harvest and effort data pulled from National Summary Query. Units of data are in Effort in Angler Trips and Harvest in numbers of fish.The data from these queries is used by state, regional and federal fisheries scientists and managers to maintain healthy and sustainable fish stocks.
Data Background and Caveats:
To properly interpret this information, it is important to consider the following key points:
- When comparing harvest estimates across an extended time series, note differences in sampling coverage through the years. Some estimates may not be comparable over long time series.
- Changes may occur between preliminary and final estimates and year to year, meaning that the data may change when updated. Please review the Limitations and other sections on the Using the Data page from the source for more information.
Northeast US
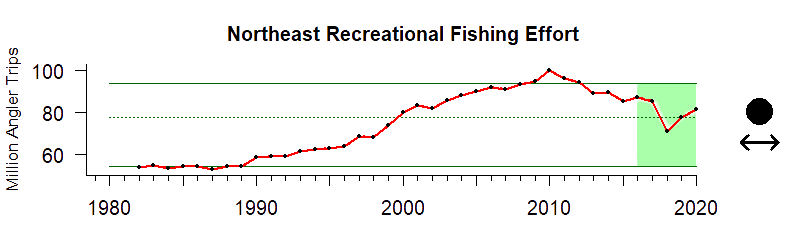
Values correspond to cumulative number of angler trips
Description of time series:
Between 2016 and 2020, recreational fishing effort in the Northeast is around historic levels and shows no trend.
Description of gauge:
The gauge value of 54 indicates that the recreational fishing effort between 2016 and 2020 for the Northeast US was higher than 54% of the recreational fishing effort values between 1982 and 2020
Extreme Gauge values:
A value of zero on the gauge means that the average effort or harvest over the last 5 years of data was below any annual value up until that point, while a value of 100 would indicate the average value over that same period was above any annual value up until that point.
Indicator Source Information
Recreational harvest and effort data pulled from National Summary Query. Units of data are in Effort in Angler Trips and Harvest in numbers of fish.The data from these queries is used by state, regional and federal fisheries scientists and managers to maintain healthy and sustainable fish stocks.
Data Background and Caveats:
To properly interpret this information, it is important to consider the following key points:
- When comparing harvest estimates across an extended time series, note differences in sampling coverage through the years. Some estimates may not be comparable over long time series.
- Changes may occur between preliminary and final estimates and year to year, meaning that the data may change when updated. Please review the Limitations and other sections on the Using the Data page from the source for more information.
Alaska
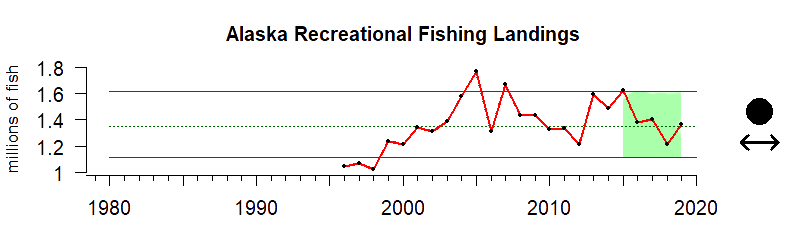
Values correspond to harvest in millions of fish
Description of time series:
Between 2015 and 2019, recreational harvest from Alaska are around historic levels. There is a significant downward trend apparent.
Description of gauge:
The gauge value of 62 indicates that the recreational fishing harvest between 2015 and 2019 for Alaska was higher than 62% of the recreational fishing harvest values between 1996 and 2019
Extreme Gauge values:
A value of zero on the gauge means that the average effort or harvest over the last 5 years of data was below any annual value up until that point, while a value of 100 would indicate the average value over that same period was above any annual value up until that point.
Indicator Source Information
Recreational harvest and effort data pulled from National Summary Query. Units of data are in Effort in Angler Trips and Harvest in numbers of fish.The data from these queries is used by state, regional and federal fisheries scientists and managers to maintain healthy and sustainable fish stocks.
Data Background and Caveats:
To properly interpret this information, it is important to consider the following key points:
- When comparing catch estimates across an extended time series, note differences in sampling coverage through the years. Some estimates may not be comparable over long time series.
- Changes may occur between preliminary and final estimates and year to year, meaning that the data may change when updated. Please review the Limitations and other sections on the Using the Data page from the source for more information.
Hawai'i
Values correspond to harvest in millions of fish
Description of time series:
Between 2016 and 2020, recreational harvest from Hawaii are around historic levels. There is a significant upward trend apparent.
Description of gauge:
The gauge value of 78 indicates that the recreational fishing harvest between 2016 and 2020 for Hawaii and the Pacific Islands was higher than 78% of the recreational fishing harvest values between 2003 and 2020
Extreme Gauge values:
A value of zero on the gauge means that the average effort or harvest over the last 5 years of data was below any annual value up until that point, while a value of 100 would indicate the average value over that same period was above any annual value up until that point.
Indicator Source Information
Recreational harvest and effort data pulled from National Summary Query. Units of data are in Effort in Angler Trips and Harvest in numbers of fish.The data from these queries is used by state, regional and federal fisheries scientists and managers to maintain healthy and sustainable fish stocks.
Data Background and Caveats:
To properly interpret this information, it is important to consider the following key points:
- When comparing catch estimates across an extended time series, note differences in sampling coverage through the years. Some estimates may not be comparable over long time series.
- Changes may occur between preliminary and final estimates and year to year, meaning that the data may change when updated. Please review the Limitations and other sections on the Using the Data page from the source for more information.
California Current
Values correspond to harvest in millions of fish
Description of time series:
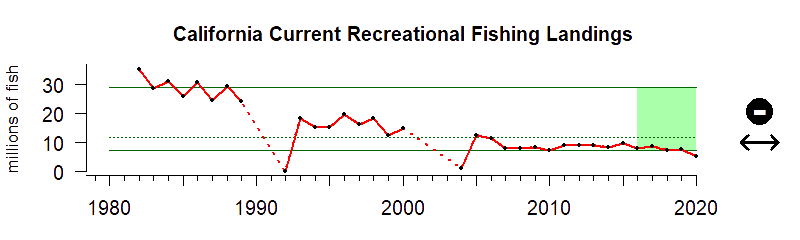
Between 2016 and 2020, recreational harvest from California Current are around historic levels. There is no significant trend apparent.
Description of gauge:
The gauge value of 12 indicates that the recreational fishing harvest between 2016 and 2020 for the California Current was higher than 12% of the recreational fishing harvest values between 1982 and 2020
Extreme Gauge values:
A value of zero on the gauge means that the average effort or harvest over the last 5 years of data was below any annual value up until that point, while a value of 100 would indicate the average value over that same period was above any annual value up until that point.
Indicator Source Information
Recreational harvest and effort data pulled from National Summary Query. Units of data are in Effort in Angler Trips and Harvest in numbers of fish.The data from these queries is used by state, regional and federal fisheries scientists and managers to maintain healthy and sustainable fish stocks.
Data Background and Caveats:
To properly interpret this information, it is important to consider the following key points:
- When comparing catch estimates across an extended time series, note differences in sampling coverage through the years. Some estimates may not be comparable over long time series.
- Changes may occur between preliminary and final estimates and year to year, meaning that the data may change when updated. Please review the Limitations and other sections on the Using the Data page from the source for more information.
Gulf of Mexico
Values correspond to harvest in millions of fish
Description of time series:
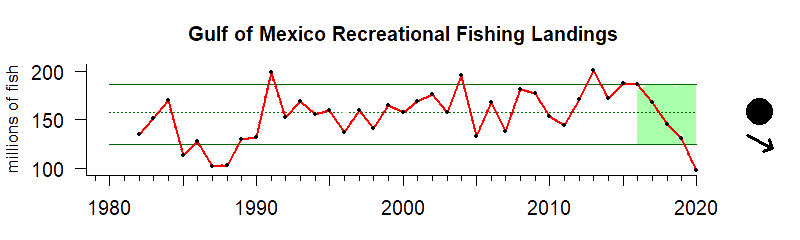
Between 2016 and 2020, recreational harvest from the Gulf of Mexico are around historic levels. There is a significant downward trend apparent.
Description of gauge:
The gauge value of 38 indicates that the recreational fishing harvest between 2016 and 2020 for the Gulf of Mexico was higher than 38% of the recreational fishing harvest values between 1982 and 2020
Extreme Gauge values:
A value of zero on the gauge means that the average effort or harvest over the last 5 years of data was below any annual value up until that point, while a value of 100 would indicate the average value over that same period was above any annual value up until that point.
Indicator Source Information
Recreational harvest and effort data pulled from National Summary Query. Units of data are in Effort in Angler Trips and Harvest in numbers of fish.The data from these queries is used by state, regional and federal fisheries scientists and managers to maintain healthy and sustainable fish stocks.
Data Background and Caveats:
To properly interpret this information, it is important to consider the following key points:
- When comparing catch estimates across an extended time series, note differences in sampling coverage through the years. Some estimates may not be comparable over long time series.
- Changes may occur between preliminary and final estimates and year to year, meaning that the data may change when updated. Please review the Limitations and other sections on the Using the Data page from the source for more information.
Southeast US
Values correspond to harvest in millions of fish
Description of time series:
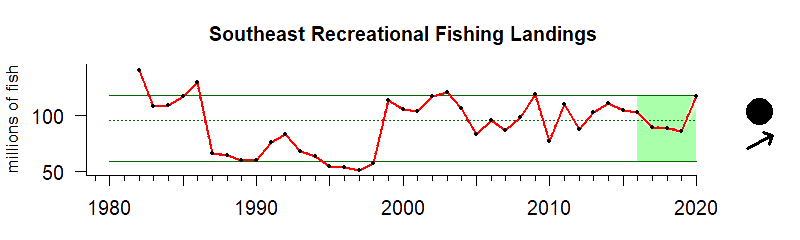
Between 2016 and 2020, recreational harvest from Southeast are around historic levels. There is no significant trend apparent.
Description of gauge:
The gauge value of 51 indicates that the recreational fishing harvest between 2016 and 2020 for the Southeast US was higher than 51% of the recreational fishing harvest values between 1982 and 2020
Extreme Gauge values:
A value of zero on the gauge means that the average effort or harvest over the last 5 years of data was below any annual value up until that point, while a value of 100 would indicate the average value over that same period was above any annual value up until that point.
Indicator Source Information
Recreational harvest and effort data pulled from National Summary Query. Units of data are in Effort in Angler Trips and Harvest in numbers of fish.The data from these queries is used by state, regional and federal fisheries scientists and managers to maintain healthy and sustainable fish stocks.
Data Background and Caveats:
To properly interpret this information, it is important to consider the following key points:
- When comparing catch estimates across an extended time series, note differences in sampling coverage through the years. Some estimates may not be comparable over long time series.
- Changes may occur between preliminary and final estimates and year to year, meaning that the data may change when updated. Please review the Limitations and other sections on the Using the Data page from the source for more information.
Northeast US
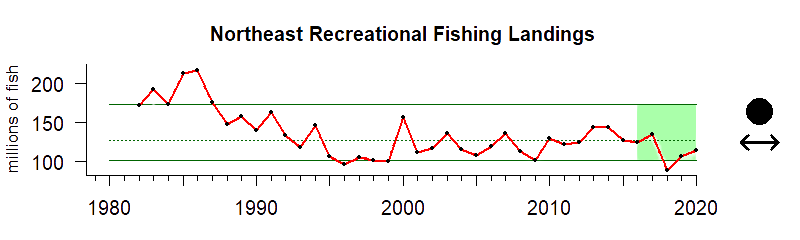
Values correspond to harvest in millions of fish
Description of time series:
Between 2016 and 2020, recreational harvest from Northeast are around historic levels. There is no significant trend apparent.
Description of gauge:
The gauge value of 28 indicates that the recreational fishing harvest between 2016 and 2020 for the Northeast US was higher than 28% of the recreational fishing harvest values between 1982 and 2020
Extreme Gauge values:
A value of zero on the gauge means that the average effort or harvest over the last 5 years of data was below any annual value up until that point, while a value of 100 would indicate the average value over that same period was above any annual value up until that point.
Indicator Source Information
Recreational harvest and effort data pulled from National Summary Query. Units of data are in Effort in Angler Trips and Harvest in numbers of fish.The data from these queries is used by state, regional and federal fisheries scientists and managers to maintain healthy and sustainable fish stocks.
Data Background and Caveats:
To properly interpret this information, it is important to consider the following key points:
- When comparing catch estimates across an extended time series, note differences in sampling coverage through the years. Some estimates may not be comparable over long time series.
- Changes may occur between preliminary and final estimates and year to year, meaning that the data may change when updated. Please review the Limitations and other sections on the Using the Data page from the source for more information.

RecFin
Established in 1992, the Pacific Coast Recreational Fisheries Information Network is designed to integrate state and federal marine recreational fishery sampling efforts into a single database to provide important biological, social, and economic data for Pacific coast recreational fishery biologists, managers and anglers.
The three Interstate Marine Fishery Commissions are critical to managing and conserving our shared coastal fisheries within the first three miles of the nation’s coastline. The Commissions were formed as interstate compacts by the coastal states of the Atlantic, Pacific and Gulf of Mexico and chartered by the United States Congress in recognition that “fish do not adhere to political boundaries.” The Commissions serve as a deliberative body, coordinating the conservation and management of the states shared near-shore fishery resources – marine, shell, and anadromous – for sustainable use.