
Description of Zooplankton:
Zooplankton are a diverse group of animals found in oceans, bays, and estuaries. By eating phytoplankton, and each other, zooplankton play a significant role in the transfer of materials and energy up the oceanic food web (e.g., fish, birds, marine mammals, humans.) Like phytoplankton, environmental and oceanographic factors continuously influence the abundance, composition and spatial distribution of zooplankton. These include the abundance and type of phytoplankton present in the water, as well as the water’s temperature, salinity, oxygen, and pH. Zooplankton can rapidly react to changes in their environment. For this reason monitoring the status of zooplankton is essential for detecting changes in, and evaluating the status of ocean ecosystems. We present the annual average total biovolume of zooplankton in the Alaska, California Current, Gulf of Mexico, Hawai'i-Pacific Islands and Northeast regions.
Data Source:
Zooplankton data for each region were obtained from the NOAA Fisheries Coastal & Oceanic Plankton Ecology, Production, & Observations Database, an integrated data set of quality-controlled, globally distributed plankton biomass and abundance data with common biomass units and served in a common electronic format with supporting documentation and access software.
Understanding the Time series plots
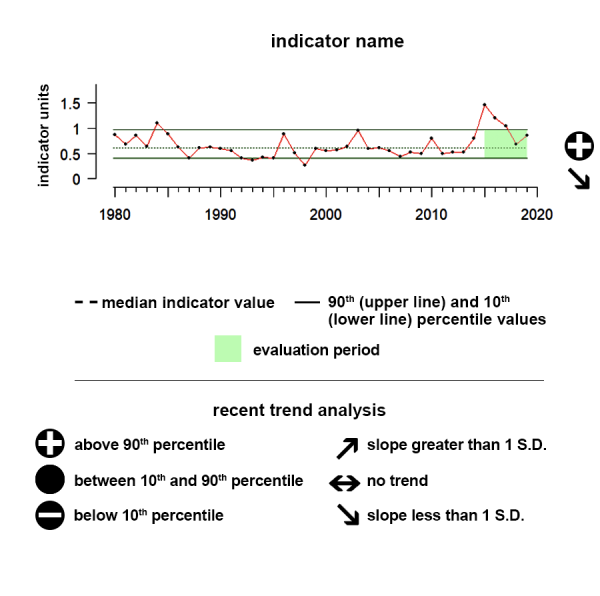
Time series plots show the changes in each indicator as a function of time, over the period 1980-present. Each plot also shows horizontal lines that indicate the median (middle) value of that indicator, as well as the 10th and 90th percentiles, each calculated for the entire period of measurement. Time series plots were only developed for datasets with at least 10 years of data. Two symbols located to the right of each plot describe how recent values of an indicator compare against the overall series. A black circle indicates whether the indicator values over the last five years are on average above the series 90th percentile (plus sign), below the 10th percentile (minus sign), or between those two values (solid circle). Beneath that an arrow reflects the trend of the indicator over the last five years; an increase or decrease greater than one standard deviation is reflected in upward or downward arrows respectively, while a change of less than one standard deviation is recorded by a left-right arrow.
Alaska
Eastern Bering Sea
Description of time series:
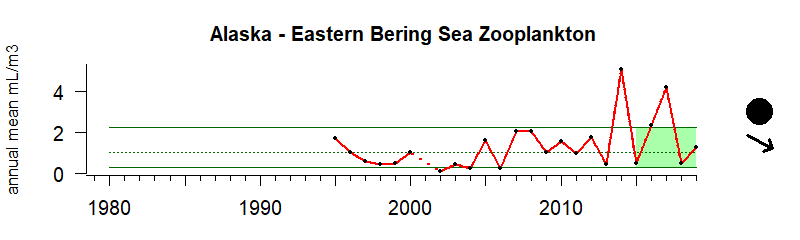
Between 2015 and 2019 the average concentration of zooplankton biomass showed no significant trend.
Description of gauge:
The gauge value of 75 indicates that between 2015 and 2019 the average concentration of zooplankton biomass in Alaskan waters was much higher than the median value of all zooplankton biomass concentration levels between 1995 and 2019.
Gauge values
High values of zooplankton can be good (lots of lipid rich colder water species) or bad (lots of lipid poor warmer water species), depending on the region.
0 - 10: The five-year zooplankton biomass average is very low compared to the median value.
10 - 25: The five-year zooplankton biomass average is much lower than the median value.
25 - 50: The five-year zooplankton biomass average is lower than the median value.
50: The five-year zooplankton biomass average equals the median value.
50 - 75: The five-year zooplankton biomass average is higher than the median value.
75 - 90: The five-year zooplankton biomass average is much higher than the median value.
90 - 100: The five-year zooplankton biomass average is very high compared to the median value.
Indicator information
Zooplankton data for each region were obtained from the NOAA Fisheries Coastal & Oceanic Plankton Ecology, Production, & Observations Database, an integrated data set of quality-controlled, globally distributed plankton biomass and abundance data with common biomass units and served in a common electronic format with supporting documentation and access software. Alaska specific data comes from the Ecosystems and Fisheries-Oceanography Coordinated Investigations (EcoFOCI): https://www.ecofoci.noaa.gov/
Data Background and Caveats:
Unlike previous years, all value are now standardized to "ml/m3". For example, EcoMon data units went from "ml/100m3" to just "ml/m3", but that did not affect the shape of the trends as it is a linear multiplicative factor. CalCOFI, however, went from "ml/m2" to "ml/m3", and the trend has changed noticeably. It is now noisier and no clear trend. One converts "ml/m2" to "ml/m3" by dividing by the towing depth (m). That is a non-linear muplicative factor, so it can affect each data point and change the data shape.
HI -Note that Hawai’i is Wet Mass (g/m3) , not DV (ml/m3).
Finally, a log10 value frequency histogram of the raw data values showed that 99.9% of the DV data values were less than 15 ml/m3. To reduce the impact of large outliers (i.e., due to a large jellyfish or an algal mat caught in the net), any DV value greater than 15 was capped at a value of just 15. Again, this would only affect < 0.1% of the data. In some extreme cases, original DV values were over 100+ ... which greatly skewed the means and trends if not removed. This is actually standard practice. CalCOFI offers both a "large" and "small" DV value (with the latter having large values removed), for example, and some programs automatically remove any plankter larger than the 5 cm length from the net sample before measuring the DV.
Zooplankton data for each region were obtained from the NOAA Fisheries Coastal & Oceanic Plankton Ecology, Production, & Observations Database, an integrated data set of quality-controlled, globally distributed plankton biomass and abundance data with common biomass units and served in a common electronic format with supporting documentation and access software. Source: https://www.st.nmfs.noaa.gov/copepod/about/about-copepod.html
Alaska
Gulf of Alaska
Description of time series:
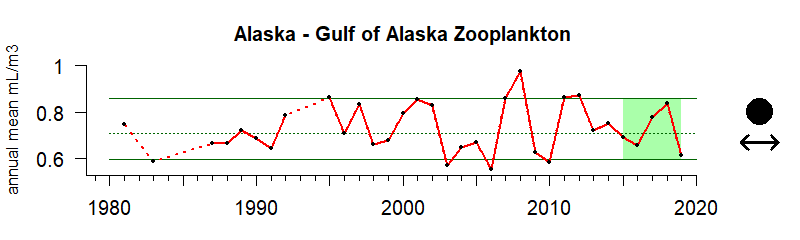
Between 2015 and 2019 the average concentration of zooplankton biomass showed no significant trend.
Description of gauge:
The gauge value of 52 indicates that between 2015 and 2019 the average concentration of zooplankton biomass in Alaskan waters was higher than the median value of all zooplankton biomass concentration levels between 1981 and 2019
Gauge values
High values of zooplankton can be good (lots of lipid rich colder water species) or bad (lots of lipid poor warmer water species), depending on the region.
0 - 10: The five-year zooplankton biomass average is very low compared to the median value.
10 - 25: The five-year zooplankton biomass average is much lower than the median value.
25 - 50: The five-year zooplankton biomass average is lower than the median value.
50: The five-year zooplankton biomass average equals the median value.
50 - 75: The five-year zooplankton biomass average is higher than the median value.
75 - 90: The five-year zooplankton biomass average is much higher than the median value.
90 - 100: The five-year zooplankton biomass average is very high compared to the median value.
Indicator information
Zooplankton data for each region were obtained from the NOAA Fisheries Coastal & Oceanic Plankton Ecology, Production, & Observations Database, an integrated data set of quality-controlled, globally distributed plankton biomass and abundance data with common biomass units and served in a common electronic format with supporting documentation and access software. Alaska specific data comes from the Ecosystems and Fisheries-Oceanography Coordinated Investigations (EcoFOCI): https://www.ecofoci.noaa.gov/
Data Background and Caveats:
Unlike previous years, all value are now standardized to "ml/m3". For example, EcoMon data units went from "ml/100m3" to just "ml/m3", but that did not affect the shape of the trends as it is a linear multiplicative factor. CalCOFI, however, went from "ml/m2" to "ml/m3", and the trend has changed noticeably. It is now noisier and no clear trend. One converts "ml/m2" to "ml/m3" by dividing by the towing depth (m). That is a non-linear muplicative factor, so it can affect each data point and change the data shape.
HI -Note that Hawai’i is Wet Mass (g/m3) , not DV (ml/m3).
Finally, a log10 value frequency histogram of the raw data values showed that 99.9% of the DV data values were less than 15 ml/m3. To reduce the impact of large outliers (i.e., due to a large jellyfish or an algal mat caught in the net), any DV value greater than 15 was capped at a value of just 15. Again, this would only affect < 0.1% of the data. In some extreme cases, original DV values were over 100+ ... which greatly skewed the means and trends if not removed. This is actually standard practice. CalCOFI offers both a "large" and "small" DV value (with the latter having large values removed), for example, and some programs automatically remove any plankter larger than the 5 cm length from the net sample before measuring the DV.
Zooplankton data for each region were obtained from the NOAA Fisheries Coastal & Oceanic Plankton Ecology, Production, & Observations Database, an integrated data set of quality-controlled, globally distributed plankton biomass and abundance data with common biomass units and served in a common electronic format with supporting documentation and access software. Source: https://www.st.nmfs.noaa.gov/copepod/about/about-copepod.html
California Current
Description of time series:
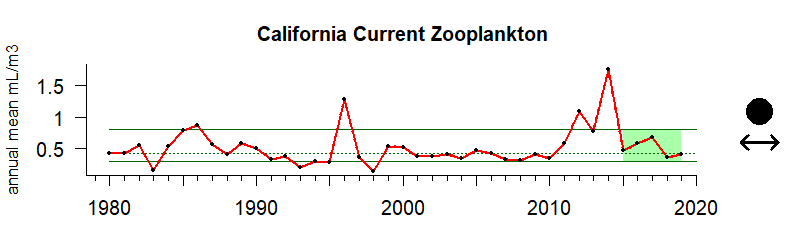
Between 2015 and 2019 the average concentration of zooplankton biomass showed no significant trend.
Description of gauge:
The gauge value of 62 indicates that between 2015 and 2019 the average concentration of zooplankton biomass was higher than the median value of all zooplankton biomass concentration levels between 1980 through 2019.
Gauge values
High values of zooplankton can be good (lots of lipid rich colder water species) or bad (lots of lipid poor warmer water species), depending on the region.
0 - 10: The five-year zooplankton biomass average is very low compared to the median value.
10 - 25: The five-year zooplankton biomass average is much lower than the median value.
25 - 50: The five-year zooplankton biomass average is lower than the median value.
50: The five-year zooplankton biomass average equals the median value.
50 - 75: The five-year zooplankton biomass average is higher than the median value.
75 - 90: The five-year zooplankton biomass average is much higher than the median value.
90 - 100: The five-year zooplankton biomass average is very high compared to the median value.
Indicator information
Zooplankton data for each region were obtained from the NOAA Fisheries Coastal & Oceanic Plankton Ecology, Production, & Observations Database, an integrated data set of quality-controlled, globally distributed plankton biomass and abundance data with common biomass units and served in a common electronic format with supporting documentation and access software. California Current specific data comes from the California Cooperative Oceanic Fisheries Investigations (CalCOFI) program: https://calcofi.org/
Data Background and Caveats:
Unlike previous years, all value are now standardized to "ml/m3". For example, EcoMon data units went from "ml/100m3" to just "ml/m3", but that did not affect the shape of the trends as it is a linear multiplicative factor. CalCOFI, however, went from "ml/m2" to "ml/m3", and the trend has changed noticeably. It is now noisier and no clear trend. One converts "ml/m2" to "ml/m3" by dividing by the towing depth (m). That is a non-linear muplicative factor, so it can affect each data point and change the data shape.
HI -Note that Hawai’i is Wet Mass (g/m3) , not DV (ml/m3).
Finally, a log10 value frequency histogram of the raw data values showed that 99.9% of the DV data values were less than 15 ml/m3. To reduce the impact of large outliers (i.e., due to a large jellyfish or an algal mat caught in the net), any DV value greater than 15 was capped at a value of just 15. Again, this would only affect < 0.1% of the data. In some extreme cases, original DV values were over 100+ ... which greatly skewed the means and trends if not removed. This is actually standard practice. CalCOFI offers both a "large" and "small" DV value (with the latter having large values removed), for example, and some programs automatically remove any plankter larger than the 5 cm length from the net sample before measuring the DV.
Zooplankton data for each region were obtained from the NOAA Fisheries Coastal & Oceanic Plankton Ecology, Production, & Observations Database, an integrated data set of quality-controlled, globally distributed plankton biomass and abundance data with common biomass units and served in a common electronic format with supporting documentation and access software. Source: https://www.st.nmfs.noaa.gov/copepod/about/about-copepod.html
It should be noted that these data are collected across multiple surveys and using multiple sampling approaches for the California Current LME.
Gulf of Mexico
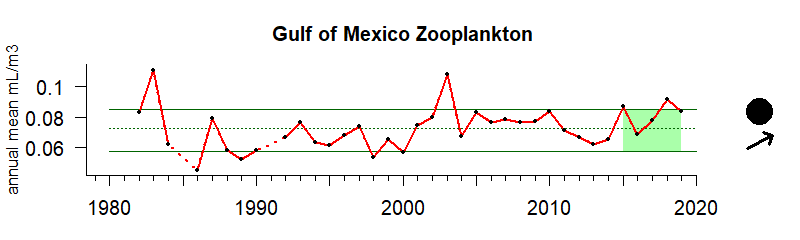
Description of time series:
Between 2015 and 2019 the average concentration of zooplankton biomass showed no significant trend.
Description of gauge:
The gauge value of 78 indicates that between 2015 and 2019 the average concentration of zooplankton biomass in the Gulf of Mexico was much higher than the median value of all zooplankton biomass concentration levels between 1982 and 2019.
Gauge values
High values of zooplankton can be good (lots of lipid rich colder water species) or bad (lots of lipid poor warmer water species), depending on the region.
0 - 10: The five-year zooplankton biomass average is very low compared to the median value.
10 - 25: The five-year zooplankton biomass average is much lower than the median value.
25 - 50: The five-year zooplankton biomass average is lower than the median value.
50: The five-year zooplankton biomass average equals the median value.
50 - 75: The five-year zooplankton biomass average is higher than the median value.
75 - 90: The five-year zooplankton biomass average is much higher than the median value.
90 - 100: The five-year zooplankton biomass average is very high compared to the median value.
Indicator information
Zooplankton data for each region were obtained from the NOAA Fisheries Coastal & Oceanic Plankton Ecology, Production, & Observations Database, an integrated data set of quality-controlled, globally distributed plankton biomass and abundance data with common biomass units and served in a common electronic format with supporting documentation and access software. California Current specific data comes from the California Cooperative Oceanic Fisheries Investigations (CalCOFI) program: https://calcofi.org/
Data Background and Caveats:
Unlike previous years, all value are now standardized to "ml/m3". For example, EcoMon data units went from "ml/100m3" to just "ml/m3", but that did not affect the shape of the trends as it is a linear multiplicative factor. CalCOFI, however, went from "ml/m2" to "ml/m3", and the trend has changed noticeably. It is now noisier and no clear trend. One converts "ml/m2" to "ml/m3" by dividing by the towing depth (m). That is a non-linear muplicative factor, so it can affect each data point and change the data shape.
HI -Note that Hawai’i is Wet Mass (g/m3) , not DV (ml/m3).
Finally, a log10 value frequency histogram of the raw data values showed that 99.9% of the DV data values were less than 15 ml/m3. To reduce the impact of large outliers (i.e., due to a large jellyfish or an algal mat caught in the net), any DV value greater than 15 was capped at a value of just 15. Again, this would only affect < 0.1% of the data. In some extreme cases, original DV values were over 100+ ... which greatly skewed the means and trends if not removed. This is actually standard practice. CalCOFI offers both a "large" and "small" DV value (with the latter having large values removed), for example, and some programs automatically remove any plankter larger than the 5 cm length from the net sample before measuring the DV.
Zooplankton data for each region were obtained from the NOAA Fisheries Coastal & Oceanic Plankton Ecology, Production, & Observations Database, an integrated data set of quality-controlled, globally distributed plankton biomass and abundance data with common biomass units and served in a common electronic format with supporting documentation and access software. Source: https://www.st.nmfs.noaa.gov/copepod/about/about-copepod.html
Hawai'i
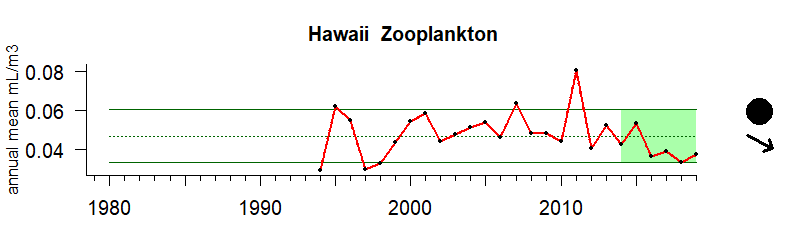
Note: this time series only represents samples from one point, Station ALOHA
Description of time series:
Between 2015 through 2019 the average concentration of zooplankton biomass showed a significant downward trend.
Description of gauge:
The gauge value of 27 indicates that between 2015 and 2019 the average concentration of zooplankton biomass in Hawaiian waters was lower than the median value of all zooplankton biomass concentration levels between 1994 and 2019.
Gauge values
High values of zooplankton can be good (lots of lipid rich colder water species) or bad (lots of lipid poor warmer water species), depending on the region.
0 - 10: The five-year zooplankton biomass average is very low compared to the median value.
10 - 25: The five-year zooplankton biomass average is much lower than the median value.
25 - 50: The five-year zooplankton biomass average is lower than the median value.
50: The five-year zooplankton biomass average equals the median value.
50 - 75: The five-year zooplankton biomass average is higher than the median value.
75 - 90: The five-year zooplankton biomass average is much higher than the median value.
90 - 100: The five-year zooplankton biomass average is very high compared to the median value.
Indicator information
Zooplankton data for each region were obtained from the NOAA Fisheries Coastal & Oceanic Plankton Ecology, Production, & Observations Database, an integrated data set of quality-controlled, globally distributed plankton biomass and abundance data with common biomass units and served in a common electronic format with supporting documentation and access software. Hawai'i specific data comes from the Hawai’i Ocean Timeseries (HOTS) program: https://hahana.soest.hawaii.edu/hot/.
Data Background and Caveats:
Unlike previous years, all value are now standardized to "ml/m3". For example, EcoMon data units went from "ml/100m3" to just "ml/m3", but that did not affect the shape of the trends as it is a linear multiplicative factor. CalCOFI, however, went from "ml/m2" to "ml/m3", and the trend has changed noticeably. It is now noisier and no clear trend. One converts "ml/m2" to "ml/m3" by dividing by the towing depth (m). That is a non-linear muplicative factor, so it can affect each data point and change the data shape.
HI -Note that Hawai’i is Wet Mass (g/m3) , not DV (ml/m3).
Finally, a log10 value frequency histogram of the raw data values showed that 99.9% of the DV data values were less than 15 ml/m3. To reduce the impact of large outliers (i.e., due to a large jellyfish or an algal mat caught in the net), any DV value greater than 15 was capped at a value of just 15. Again, this would only affect < 0.1% of the data. In some extreme cases, original DV values were over 100+ ... which greatly skewed the means and trends if not removed. This is actually standard practice. CalCOFI offers both a "large" and "small" DV value (with the latter having large values removed), for example, and some programs automatically remove any plankter larger than the 5 cm length from the net sample before measuring the DV.
Zooplankton data for each region were obtained from the NOAA Fisheries Coastal & Oceanic Plankton Ecology, Production, & Observations Database, an integrated data set of quality-controlled, globally distributed plankton biomass and abundance data with common biomass units and served in a common electronic format with supporting documentation and access software. Source: https://www.st.nmfs.noaa.gov/copepod/about/about-copepod.html
Northeastern US
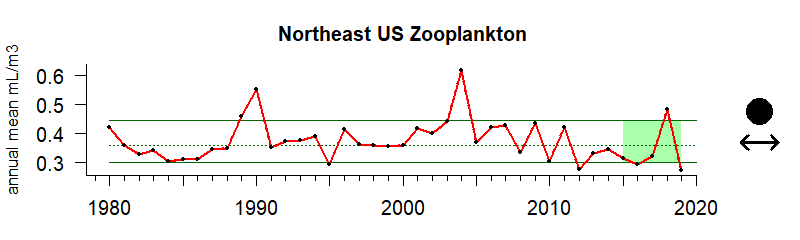
Description of time series:
Between 2015 through 2019 the average concentration of zooplankton biomass showed no significant trend.
Description of gauge:
The gauge value of 32 indicates that between 2015 and 2019 the average concentration of zooplankton biomass in Northeast US waters was lower than the median value of all zooplankton biomass concentration levels between 1980 and 2019.
Gauge values
High values of zooplankton can be good (lots of lipid rich colder water species) or bad (lots of lipid poor warmer water species), depending on the region.
0 - 10: The five-year zooplankton biomass average is very low compared to the median value.
10 - 25: The five-year zooplankton biomass average is much lower than the median value.
25 - 50: The five-year zooplankton biomass average is lower than the median value.
50: The five-year zooplankton biomass average equals the median value.
50 - 75: The five-year zooplankton biomass average is higher than the median value.
75 - 90: The five-year zooplankton biomass average is much higher than the median value.
90 - 100: The five-year zooplankton biomass average is very high compared to the median value.
Indicator information
Zooplankton data for each region were obtained from the NOAA Fisheries Coastal & Oceanic Plankton Ecology, Production, & Observations Database, an integrated data set of quality-controlled, globally distributed plankton biomass and abundance data with common biomass units and served in a common electronic format with supporting documentation and access software. Gulf of Mexico specific data comes from the Southeast Area Monitoring and Assessment Program (SEAMAP): https://www.gsmfc.org/seamap.php. The SEAMAP data were calculated and provided by David Hanisko.
Data Background and Caveats:
Unlike previous years, all value are now standardized to "ml/m3". For example, EcoMon data units went from "ml/100m3" to just "ml/m3", but that did not affect the shape of the trends as it is a linear multiplicative factor. CalCOFI, however, went from "ml/m2" to "ml/m3", and the trend has changed noticeably. It is now noisier and no clear trend. One converts "ml/m2" to "ml/m3" by dividing by the towing depth (m). That is a non-linear muplicative factor, so it can affect each data point and change the data shape.
HI -Note that Hawai’i is Wet Mass (g/m3) , not DV (ml/m3).
Finally, a log10 value frequency histogram of the raw data values showed that 99.9% of the DV data values were less than 15 ml/m3. To reduce the impact of large outliers (i.e., due to a large jellyfish or an algal mat caught in the net), any DV value greater than 15 was capped at a value of just 15. Again, this would only affect < 0.1% of the data. In some extreme cases, original DV values were over 100+ ... which greatly skewed the means and trends if not removed. This is actually standard practice. CalCOFI offers both a "large" and "small" DV value (with the latter having large values removed), for example, and some programs automatically remove any plankter larger than the 5 cm length from the net sample before measuring the DV.
Zooplankton data for each region were obtained from the NOAA Fisheries Coastal & Oceanic Plankton Ecology, Production, & Observations Database, an integrated data set of quality-controlled, globally distributed plankton biomass and abundance data with common biomass units and served in a common electronic format with supporting documentation and access software. Source: https://www.st.nmfs.noaa.gov/copepod/about/about-copepod.html

Resources
NOAA COPEPOD database
The Coastal & Oceanic Plankton Ecology, Production & Observation Database (COPEPOD) offers a variety of searching options, designed to help you find the data you desire via a variety of pathways.

Plankton Data and Visualization
The COPEPOD project was started in 2004 to integrate the vast collection of zooplankton data from NOAA Fisheries’ ecosystem monitoring programs into a U.S.-wide, and subsequently, global database of zooplankton and phytoplankton abundance, biomass, and composition. COPEPOD features hundreds of data sets from NOAA Fisheries, international, and historical plankton sampling efforts. Regional compilation and global gridded products are also available from these data.

Northwest Fisheries Science Center Zooplankton
These highly magnified images of marine organisms from Puget Sound and the Pacific Ocean were taken with a scanning electron microscope (SEM) at National Oceanic and Atmospheric Administration (NOAA), Northwest Fisheries Science Center (NWFSC) in Seattle. Occasionally, the samples examined as part of research projects have an incredible beauty, or sometimes by sheer luck, the timing is just right to show a unique moment in the life of a marine organism.

Zooplankton Research Program
Zooplankton research in the US AMLR Program focuses on the link between prey production, availability, and climate variability in relation to predator and fishery demands.