
Description of Overfished Stocks:
An overfished stock is a population of fish that is too low. From a technical standpoint, a stock that is overfished is depleted below a minimum level and active rebuilding is required. Stocks that are overfished cannot support a large amount of fishing. A fish stock can be listed as overfished as the result of many factors including overfishing, habitat degradation, pollution, climate change, and disease. The Magnuson-Stevens Act requires the status of overfished stocks be reported annually.
Stock assessments provide information to determine if a stock is overfished or experiencing overfishing (harvest higher than a maximum fishing threshold). This is done by estimating fishing intensity and the abundance of fish stocks and comparing those estimates to management reference points. Stock assessments can provide the science that supports the steps necessary to rebuild overfished stocks to sustainable levels.
It is important to track the status of fish stocks because fish play an important role in marine ecosystems, such as supporting the ecological structure of many marine food webs. Fish also support significant parts of coastal economies including recreational and commercial fisheries, and play an important cultural role in many regions.
This site presents the number of overfished stocks by year in all US Large Marine Ecosystems (LMEs).
Data Source:
Data were obtained from the NOAA Fisheries Fishery Stock Status website. Stocks that met the criteria for overfished status were summed by year for each region.
Understanding the Time series plots
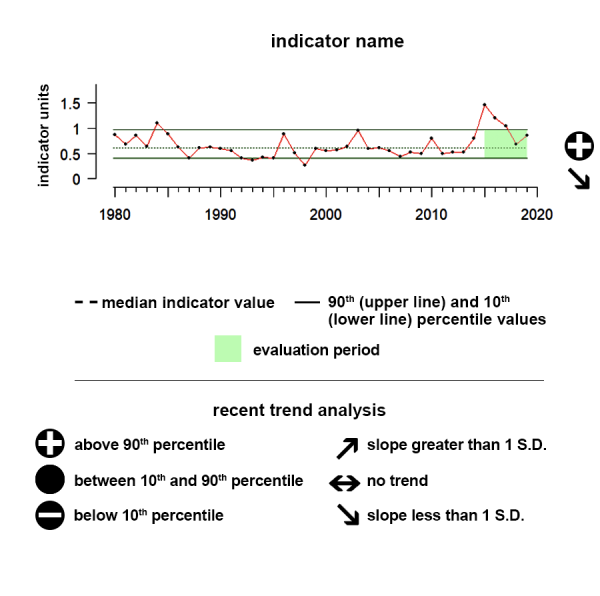
Time series plots show the changes in each indicator as a function of time, over the period 1980-present. Each plot also shows horizontal lines that indicate the median (middle) value of that indicator, as well as the 10th and 90th percentiles, each calculated for the entire period of measurement. Time series plots were only developed for datasets with at least 10 years of data. Two symbols located to the right of each plot describe how recent values of an indicator compare against the overall series. A black circle indicates whether the indicator values over the last five years are on average above the series 90th percentile (plus sign), below the 10th percentile (minus sign), or between those two values (solid circle). Beneath that an arrow reflects the trend of the indicator over the last five years; an increase or decrease greater than one standard deviation is reflected in upward or downward arrows respectively, while a change of less than one standard deviation is recorded by a left-right arrow.
Alaska
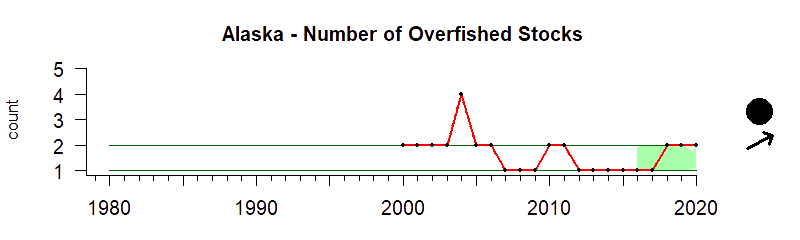
The x-axis represents years. The y-axis represents the number of fish stocks or fish populations that are deemed by NOAA as overfished. Overfished means the population of fish is too low. Therefore the population cannot support a large amount of fishing.
Description of time series:
The series shows the number of fish stocks that were determined to be overfished since 2000. Between 2016 and 2020 the number of overfished stocks showed an upward trend.
Description of gauge:
Gauge analysis was not appropriate for these data.
Overall Scores mean the following:
High values for overfished stocks are bad, low numbers are good.
- 0 - 10: The five-year overfished stock status average is very low compared to the median value.
- 10 - 25: The five-year overfished stock status average is much lower than the median value.
- 25 - 50: The five-year overfished stock status average is lower than the median value.
- 50: The five-year overfished stock status average equals the median value.
- 50 - 75: The five-year overfished stock status average is higher than the median value.
- 75 - 90: The five-year overfished stock status average is much higher than the median value.
- 90 - 100: The five-year overfished stock status average is very high compared to the median value.
Data Source:
Data were obtained from the NOAA Fisheries Fishery Stock Status website. Stocks that met the criteria for overfished status were summed by year for each region.
Hawai'i
Does not count Pacific Island-specific complexes
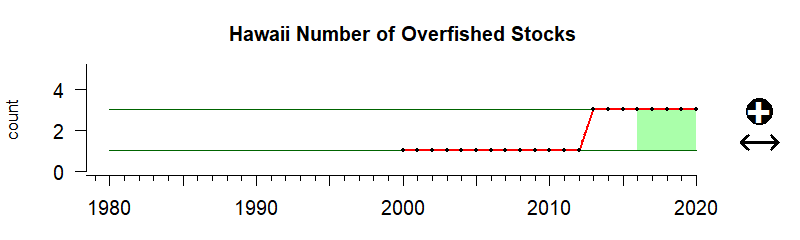
The x-axis represents years. The y-axis represents the number of fish stocks or fish populations that are deemed by NOAA as overfished. Overfished means the population of fish is too low. Therefore the population cannot support a large amount of fishing.
Description of time series:
The series shows the number of fish stocks that were determined to be overfished since 2000. Between 2016 and 2020 the number of overfished stocks shows no trend
Description of gauge:
Gauge analysis was not appropriate for these data.
Overall Scores mean the following:
High values for overfished stocks are bad, low numbers are good.
- 0 - 10: The five-year overfished stock status average is very low compared to the median value.
- 10 - 25: The five-year overfished stock status average is much lower than the median value.
- 25 - 50: The five-year overfished stock status average is lower than the median value.
- 50: The five-year overfished stock status average equals the median value.
- 50 - 75: The five-year overfished stock status average is higher than the median value.
- 75 - 90: The five-year overfished stock status average is much higher than the median value.
- 90 - 100: The five-year overfished stock status average is very high compared to the median value.
Data Source:
Data were obtained from the NOAA Fisheries Fishery Stock Status website. Stocks that met the criteria for overfished status were summed by year for each region.
California Current
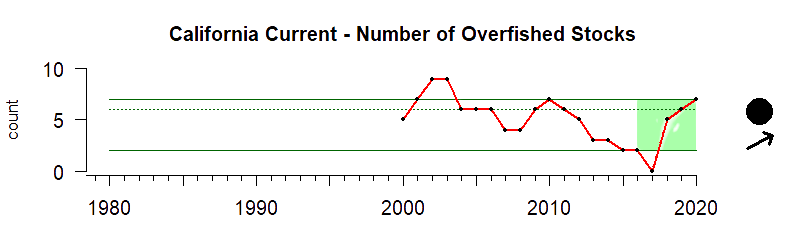
The x-axis represents years. The y-axis represents the number of fish stocks or fish populations that are deemed by NOAA as overfished. Overfished means the population of fish is too low. Therefore the population cannot support a large amount of fishing.
Description of time series:
The series shows the number of fish stocks that were determined to be overfished since 2000. Between 2016 and 2020 the number of overfished stocks shows an upward trend.
Description of gauge:
Gauge analysis was not appropriate for these data.
Overall Scores mean the following:
High values for overfished stocks are bad, low numbers are good.
- 0 - 10: The five-year overfished stock status average is very low compared to the median value.
- 10 - 25: The five-year overfished stock status average is much lower than the median value.
- 25 - 50: The five-year overfished stock status average is lower than the median value.
- 50: The five-year overfished stock status average equals the median value.
- 50 - 75: The five-year overfished stock status average is higher than the median value.
- 75 - 90: The five-year overfished stock status average is much higher than the median value.
- 90 - 100: The five-year overfished stock status average is very high compared to the median value.
Data Source:
Data were obtained from the NOAA Fisheries Fishery Stock Status website. Stocks that met the criteria for overfished status were summed by year for each region.
Gulf of Mexico
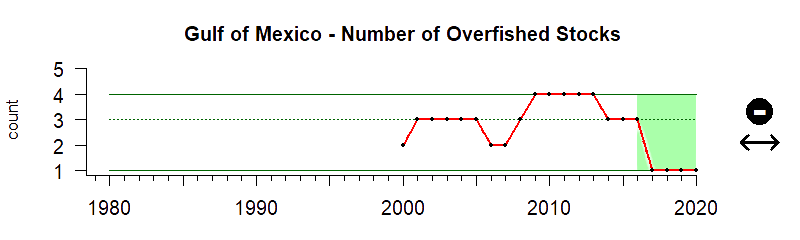
The x-axis represents years. The y-axis represents the number of fish stocks or fish populations that are deemed by NOAA as overfished. Overfished means the population of fish is too low. Therefore the population cannot support a large amount of fishing.
Description of time series:
The series shows the number of fish stocks that were determined to be overfished since 2000. Between 2016 and 2020 the number of overfished stocks shows no trend.
Description of gauge:
Gauge analysis was not appropriate for these data.
Overall Scores mean the following:
High values for overfished stocks are bad, low numbers are good.
- 0 - 10: The five-year overfished stock status average is very low compared to the median value.
- 10 - 25: The five-year overfished stock status average is much lower than the median value.
- 25 - 50: The five-year overfished stock status average is lower than the median value.
- 50: The five-year overfished stock status average equals the median value.
- 50 - 75: The five-year overfished stock status average is higher than the median value.
- 75 - 90: The five-year overfished stock status average is much higher than the median value.
- 90 - 100: The five-year overfished stock status average is very high compared to the median value.
Data Source:
Data were obtained from the NOAA Fisheries Fishery Stock Status website. Stocks that met the criteria for overfished status were summed by year for each region.
Caribbean
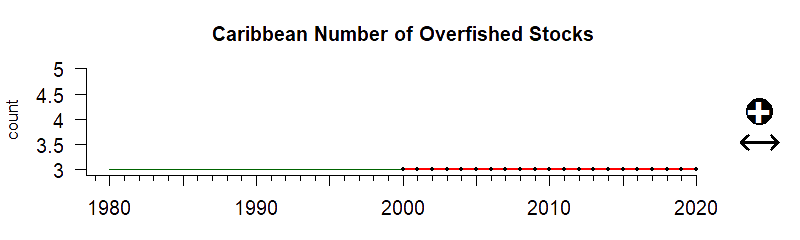
The x-axis represents years. The y-axis represents the number of fish stocks or fish populations that are deemed by NOAA as overfished. Overfished means the population of fish is too low. Therefore the population cannot support a large amount of fishing.
Description of time series:
The series shows the number of fish stocks that were determined to be overfished since 2000. Between 2016 and 2020 the number of overfished stocks shows no trend.
Description of gauge:
Gauge analysis was not appropriate for these data.
Overall Scores mean the following:
High values for overfished stocks are bad, low numbers are good.
- 0 - 10: The five-year overfished stock status average is very low compared to the median value.
- 10 - 25: The five-year overfished stock status average is much lower than the median value.
- 25 - 50: The five-year overfished stock status average is lower than the median value.
- 50: The five-year overfished stock status average equals the median value.
- 50 - 75: The five-year overfished stock status average is higher than the median value.
- 75 - 90: The five-year overfished stock status average is much higher than the median value.
- 90 - 100: The five-year overfished stock status average is very high compared to the median value.
Data Source:
Data were obtained from the NOAA Fisheries Fishery Stock Status website. Stocks that met the criteria for overfished status were summed by year for each region.
Southeast
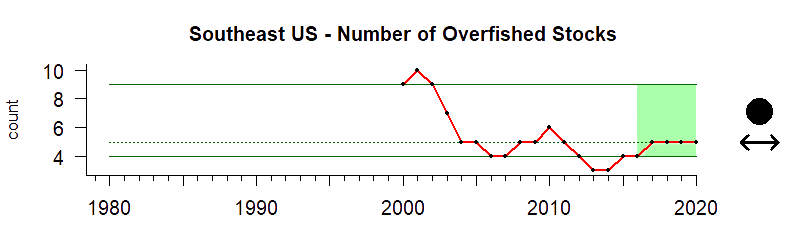
The x-axis represents years. The y-axis represents the number of fish stocks or fish populations that are deemed by NOAA as overfished. Overfished means the population of fish is too low. Therefore the population cannot support a large amount of fishing.
Description of time series:
The series shows the number of fish stocks that were determined to be overfished since 2000. Between 2016 and 2020 the number of overfished stocks shows no trend.
Description of gauge:
Gauge analysis was not appropriate for these data.
Overall Scores mean the following:
High values for overfished stocks are bad, low numbers are good.
- 0 - 10: The five-year overfished stock status average is very low compared to the median value.
- 10 - 25: The five-year overfished stock status average is much lower than the median value.
- 25 - 50: The five-year overfished stock status average is lower than the median value.
- 50: The five-year overfished stock status average equals the median value.
- 50 - 75: The five-year overfished stock status average is higher than the median value.
- 75 - 90: The five-year overfished stock status average is much higher than the median value.
- 90 - 100: The five-year overfished stock status average is very high compared to the median value.
Data Source:
Data were obtained from the NOAA Fisheries Fishery Stock Status website. Stocks that met the criteria for overfished status were summed by year for each region.
Northeast
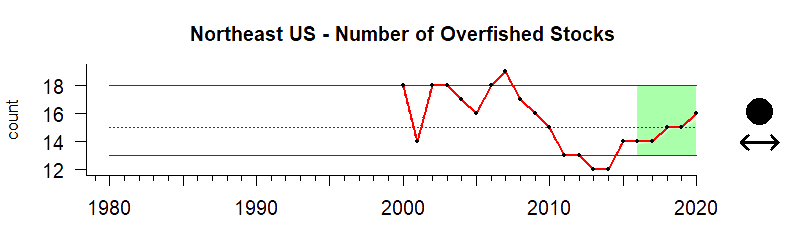
The x-axis represents years. The y-axis represents the number of fish stocks or fish populations that are deemed by NOAA as overfished. Overfished means the population of fish is too low. Therefore the population cannot support a large amount of fishing.
Description of time series:
The series shows the number of fish stocks that were determined to be overfished since 2000. Between 2016 and 2020 the number of overfished stocks shows no trend.
Description of gauge:
Gauge analysis was not appropriate for these data.
Overall Scores mean the following:
High values for overfished stocks are bad, low numbers are good.
- 0 - 10: The five-year overfished stock status average is very low compared to the median value.
- 10 - 25: The five-year overfished stock status average is much lower than the median value.
- 25 - 50: The five-year overfished stock status average is lower than the median value.
- 50: The five-year overfished stock status average equals the median value.
- 50 - 75: The five-year overfished stock status average is higher than the median value.
- 75 - 90: The five-year overfished stock status average is much higher than the median value.
- 90 - 100: The five-year overfished stock status average is very high compared to the median value.
Data Source:
Data were obtained from the NOAA Fisheries Fishery Stock Status website. Stocks that met the criteria for overfished status were summed by year for each region.

Resources
Status of U.S. Fisheries Report to Congress and Fishery Stock Status Updates
NOAA Fisheries publishes the annual Status of U.S. Fisheries Report to Congress of fish stocks managed under federal fishery management plans, and updates the status quarterly based on stock assessments completed during that quarter.

Status of U.S. Fisheries
NOAA Fisheries’ Office of Sustainable Fisheries updates the status of fish stocks managed under federal fishery management plans quarterly based on stock assessments completed during that quarter.

Stock SMART - Status, Management, Assessments & Resource Trends
Marine Fisheries in the United States are among the world’s largest and most sustainable. Fisheries support over a million jobs and contribute billions of dollars to the U.S. economy each year. NOAA Fisheries is responsible for managing U.S. marine fishery resources and uses sound science to balance productive and sustainable fisheries with healthy ecosystems. Stock assessments are an important tool NOAA Fisheries uses to monitor the condition of fish stocks and provide the science information that resource managers need to sustainably manage them.
Stock SMART is NOAA Fisheries' Stock Status, Management, Assessment, and Resource Trends web tool. Here, you can find applications to search, view, compare, and download the results of assessments for stocks managed by NOAA Fisheries. Keep reading to learn more about each of Stock SMART’s applications or click on a menu item to get started.

FOSS - Fisheries One Stop Shop
NOAA Fisheries One Stop Shop Database
